End Point Blogging Stats Year In Review

By Steph Skardal
January 4, 2010
Many of the blogs I follow recently published a list of most popular articles from 2009, so I thought we should too. End Point started the blog in July of 2008, and has since then backported our older technical articles and company news to the blog, which is why you may see older articles in the archives. In 2009, we published just over 150 articles.
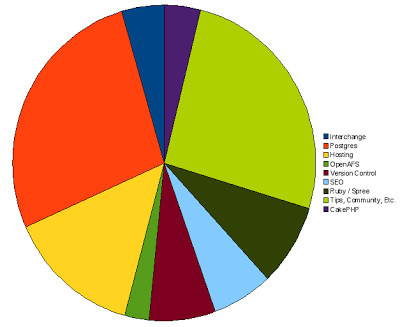
Here’s a breakdown of article categories (the categorization was a bit difficult: the “Tips, Community, Etc.” was a fallback category for any articles that didn’t have more than a few similar articles):
In 2009, the top 10 articles with the highest number of unique visitors were:
- /blog/2008/07/git-push-know-your-refspecs
- /blog/2008/11/10000-databases-on-postgresql-cluster
- /blog/2009/02/slony1-200-postgresql-84devel
- /blog/2009/01/slow-xen-virtualization-of-rhel-3-i386
- /blog/2009/08/file-test-comparison-table-for-shell
- /blog/2009/12/mysql-and-postgres-command-equivalents
- /blog/2008/08/switching-from-sendmail-to-postfix-on
- /blog/2008/11/multiple-reverse-dns-pointers-per-ip
- /blog/2008/08/acts-as-xapian-it-just-works
- /blog/2008/12/truecrypte-whole-disk-encryption-for
The top 10 “Top Pages”, according to a tool provided by SEOmoz, which is calculated using SEOmoz popularity metrics based on external links and quality of external linking pages to the url, are:
- /blog/2009/09/migrating-postgres-with-bucardo-4
- /blog/2009/08/text-sequences
- /blog/2008/07/git-push-know-your-refspecs
- /blog/2009/07/bucardo-and-truncate-triggers
- /blog/2009/09/seo-external-links-and-pagerank
- /blog/2009/09/permission-denied-for-postgresqlconf
- /blog/2009/07/mdx
- /blog/2009/08/two-quick-tips-egrep-sql-dumps-vim-and
- /blog/2009/07/slony-slstatus-and-diagnosing
- /blog/2009/08/perlpostgres-changes-in-dbdpg-2151
It would probably be more interesting to normalize the data above by the total number of days published to get an idea of which articles were the most impacting. This is likely an example of normalization that search engines employ in popularity algorithms.
The lamest articles, ordered by the number of unique visitors ascending, were:
- /blog/2005/06/death-taxes-and-spam
- /blog/2008/02/dbdpg-200-released
- /blog/2005/08/end-point-celebrates-10-years-of
- /blog/2008/08/camps-presentation-at-utosc-2008
- /blog/2008/06/railsconf-2008-report
- /blog/2008/06/pgcon-2008-report
- /blog/2006/06/review-practices-of-agile-developer
- /blog/2006/01/interchange-54-released
- /blog/2005/08/rowe-promotes-good-data-vpns
Phew—none of my articles were on that list :)
I should probably note that those aren’t really lame articles. They likely didn’t get a ton of traffic because they were published around the time we started our blog that received little traffic at the time and because they probably weren’t marketed through social media as some of our recent blog articles have been.
But what does this all mean?
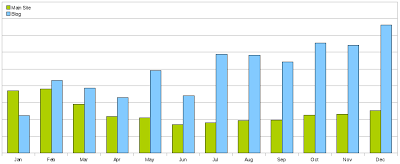
This past year, I’ve approached blogging as a sales or marketing tool to get traffic from potential clients or to inform existing clients of the variety of services we provide. So, I was interested in comparing traffic between our blog and main site. The graph below shows the total page views for the main site and blog:
And I was interested in looking at the amount of referral traffic (page views again) our main site receives from the blog:
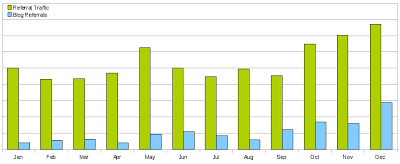
It’s pretty cool that in the last few months, our blog traffic has been 2 to 3 times as much as our main web site. And also interesting that 1/4 to 1/3 of the referral traffic to our main site came from our blog in the last few months. Referral traffic makes up roughly one third of our main site traffic, so we get about 10% of total traffic from blog referral traffic—which is fairly effective.
There are many other metrics I’m interested in, specifically segmenting our traffic into categories similar to the blog categories in the pie chart above to examine which topics bring us the most traffic. I hope we continue to blog about topics that bring us unique (and converting) traffic. But I’ll save discussion of those metrics for another blog article, that hopefully won’t make the “2010 Lamest Blog Articles” list :)
Comments