Spree Performance Benchmarking

By Steph Skardal
May 25, 2011
I see a lot of questions regarding Spree performance in the spree-user group, but they are rarely answered with metrics. I put together a quick script using the generic benchmark tool ab to review some data. Obviously, the answer to how well a site performs and scales is highly dependent on the host and the consumption of the web application, so the data here needs to be taken with a grain of salt. Another thing to note is that only two of the following use cases are running on Rails 3.0 — many of our current Spree clients are on Spree 0.11.2 or older. I also included one non-Spree Rails ecommerce application, in addition to a few non-Rails applications for comparison. All of the tests were run from my home network, so in theory there shouldn’t be bias on performance tests for sites running on End Point servers.
| ab -n 100 | |||||
| -c 2 homepage | -c 20 homepage | -c 2 product page | -c 20 product page | ||
| Client #1 Spree: 0.11.2 Hosting: 4 cores, 512 GB RAM DB: MySQL # Products: <100 | 7.49 | 24.75 | 6.49 | 19.87 | Requests per second |
| 266.889 | 808.041 | 307.997 | 1006.552 | Time per request (ms) | |
| Client #2 Spree 0.11.2 Hosting: Engineyard, medium instance DB: MySQL # Products: 100s | 5.32 | 20.28 | 5.36 | 18.03 | Requests per second |
| 375.713 | 986.309 | 373.289 | 1109.524 | Time per request (ms) | |
| Client #3 Spree: 0.9.0 Hosting: 4 cores, 1 GB RAM DB: PostgreSQL # Products: <100 | 4.91 | 25.39 | 1.98 | 6.54 | Requests per second |
| 407.135 | 787.782 | 1011.875 | 3060.062 | Time per request (ms) | |
| (Former) Client #4 Spree: 0.11.2 Hosting: Unknown DB: PostgreSQL # Products: >5000 | 20.69 | 8.84 | 10.15 | 19.28 | Requests per second |
| 96.673 | 2262.105 | 196.996 | 1037.146 | Time per request (ms) | |
| Client #5 Spree: 0.11.2 Hosting: EngineYard, small instance DB: MySQL # Products: 1 | 12.28 | 16.23 | N/A | N/A | Requests per second |
| 162.909 | 1231.945 | N/A | N/A | Time per request (ms) | |
| Client #6 Spree: 0.40 Hosting: 4 cores, 1 GB RAM DB: MySQL # Products: 50-100 | 3.61 | 8.93 | 2.96 | 3.06 | Requests per second |
| 553.569 | 2240.657 | 675.306 | 6539.433 | Time per request (ms) | |
| SpreeDemo Spree: Edge Hosting: Heroku, 2 dynos DB: Unknown # Products: 100s | 8.17 | 12.79 | 4.7 | 5.48 | Requests per second |
| 244.831 | 1563.642 | 425.27 | 3652.927 | Time per request (ms) | |
| Client #7 *custom Rails ecommerce app Hosting: 1.0 GB RAM DB: MySQL # Products: 1000s | 5.43 | 29.8 | 4.45 | 23.14 | Requests per second |
| 368.409 | 671.082 | 448.962 | 864.24 | Time per request (ms) | |
| Interchange Demo Hosting: 4 cores, 2 GB RAM DB: MySQL # Products: >500 | 7.41 | 55.27 | 7.5 | 13.93 | Requests per second |
| 269.942 | 361.875 | 266.492 | 1435.51 | Time per request (ms) | |
| Client #8 *PHP site, serves fully cached pages with nginx with no app server or db hits Hosting: 4 cores, 4 GB RAM | 10.81 | 30.54 | 6.05 | 9.87 | Requests per second |
| 184.994 | 654.858 | 330.727 | 2027.092 | Time per request (ms) | |
| Magento Demo Hosting: Unknown DB: Unknown # Products: 100s | 4.26 | 44.85 | 2.68 | 36.29 | Requests per second |
| 469.831 | 445.931 | 745.472 | 551.11 | Time per request (ms) | |
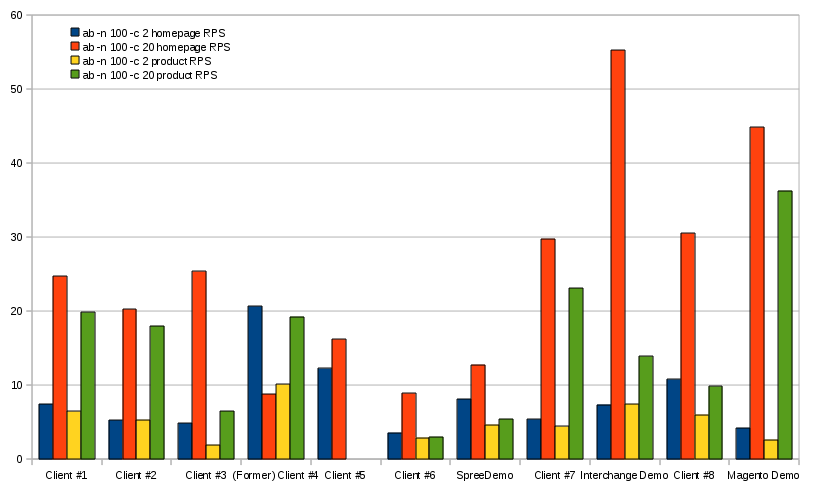
Here’s the same data in graphical form:
Requests per Second
Time Per Request (ms)
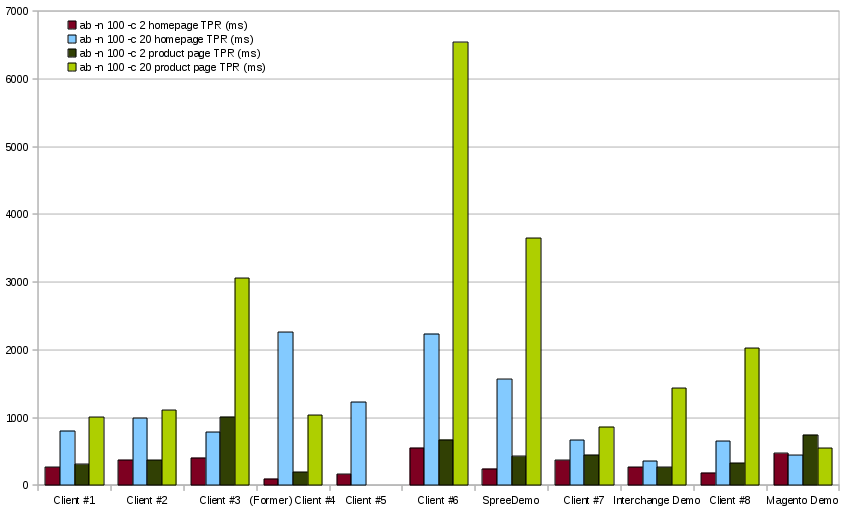
We expect to see high performance on some of the sites with significant performance optimization. On smaller VPS, we expect to see the the server choke with higher concurrency.
interchange performance rails scalability spree magento
Comments