Convenient Reporting with Jasper

By Árpád Lajos
April 28, 2020
Business Intelligence (BI) reporting is a huge problem space in custom software. There’s a wide range of business needs for looking at past and predictive behavior. Building a reporting tool can be a very cost effective way to get this data, especially compared to writing individual queries or manually generating reports.
I’ve been working with Jasper in the Java project space and wanted to write about some research I’ve collected on the topic.
JasperReports takes .jrxml files as input and outputs a .jasper report. Possible output targets include:
- Screen
- Printer
- HTML
- Excel files
- RTF
- ODT
- CSV
- XML
Jasper history
- June 2001: Teodor Danciu began working on JasperReports.
- September 2001: Jasper was registered on SourceForge.
- November 2001: JasperReports 0.1.5 was released.
- 2004: Panscopic teamed up with Teodor Danciu, acquired ownership of the product and changed its name to Jaspersoft.
- 2005: JasperReports 1.0 was released.
- 2007: Brian Gentile became CEO of the company.
- 2014: TIBCO acquired Jaspersoft for ~$185 million.
Best reporting tools
Let’s compare some popular reporting tools:
- JasperReports is a free and open source Java-based reporting tool, which supports lots of possible outputs, as mentioned earlier. Generating reports can be difficult if you’re less technical. More technical aspects can be more difficult as well; embedding JasperReports into a project is not necessarily simple, but once it’s done, the tool will be reliable.
- Crystal Reports supports many inputs, including Access, Excel, XML, ODBC, and JDBC. It also has good multi-language support. It’s easy to embed into a .NET project, but software updates are unstable. The process can be very slow and there is no control of data-level security. A trial version is offered, but if one wants to use it long-term, then the price is a one-time payment of $495 or more, for larger companies.
- Domo is another a popular reporting tool. It provides a trial version, and a 5 user plan costs $5700/year*.
- Zoho analytics is an easy-to-use BI reporting tool, priced between $22–$445, depending on the number of users and data.
- Host analytics is a great tool for finance automation. Pricing not publicized.
- Tableau is an excellent reporting tool, with a thriving community online, but its quote-based price is high.
- Pentaho is a Java-based reporting tool, which provides data integration, online analytical processing and reporting, among other features. Pentaho offers a 30-day trial period. Contract pricing isn’t disclosed.
So, if you are writing software and already use Java, or using Java reporting is an option, JasperReports is a great choice. It supports a variety of outputs, is free to use, and open source.
Installing JasperReports Server
To install JasperReports Server, you need a computer with a fully functional JRE (Java Runtime Environment). The server might be Tomcat or GlassFish. An RDBMS is also needed. since JasperReports has its own database, this could be PostgreSQL, Oracle, MySQL, DB2, or SQL Server. JasperReports prefers PostgreSQL and Tomcat, so these will be included with an automatic install. You may choose to use your existing Tomcat/PostgreSQL or have it install them as well.
Manual installation is also possible, as described here. At my first encounter with Jasper I installed Tomcat with the installer and used it for generating JasperReports, while the application I was working with was running WildFly (formerly JBoss), using a MySQL database. Needless to say, this was unnecessary, but I was not aware of that at the time. JasperServer can be configured to work with JBoss and MySQL as well.
The core of JasperReports is the JasperReports Library, which was already integrated into the project I was working with and is integrated into JasperReports Server as well as into popular IDEs, like TIBCO Jaspersoft Studio or iReport Designer.
Database
JasperReports provides example databases for imaginary companies, like FoodMart:
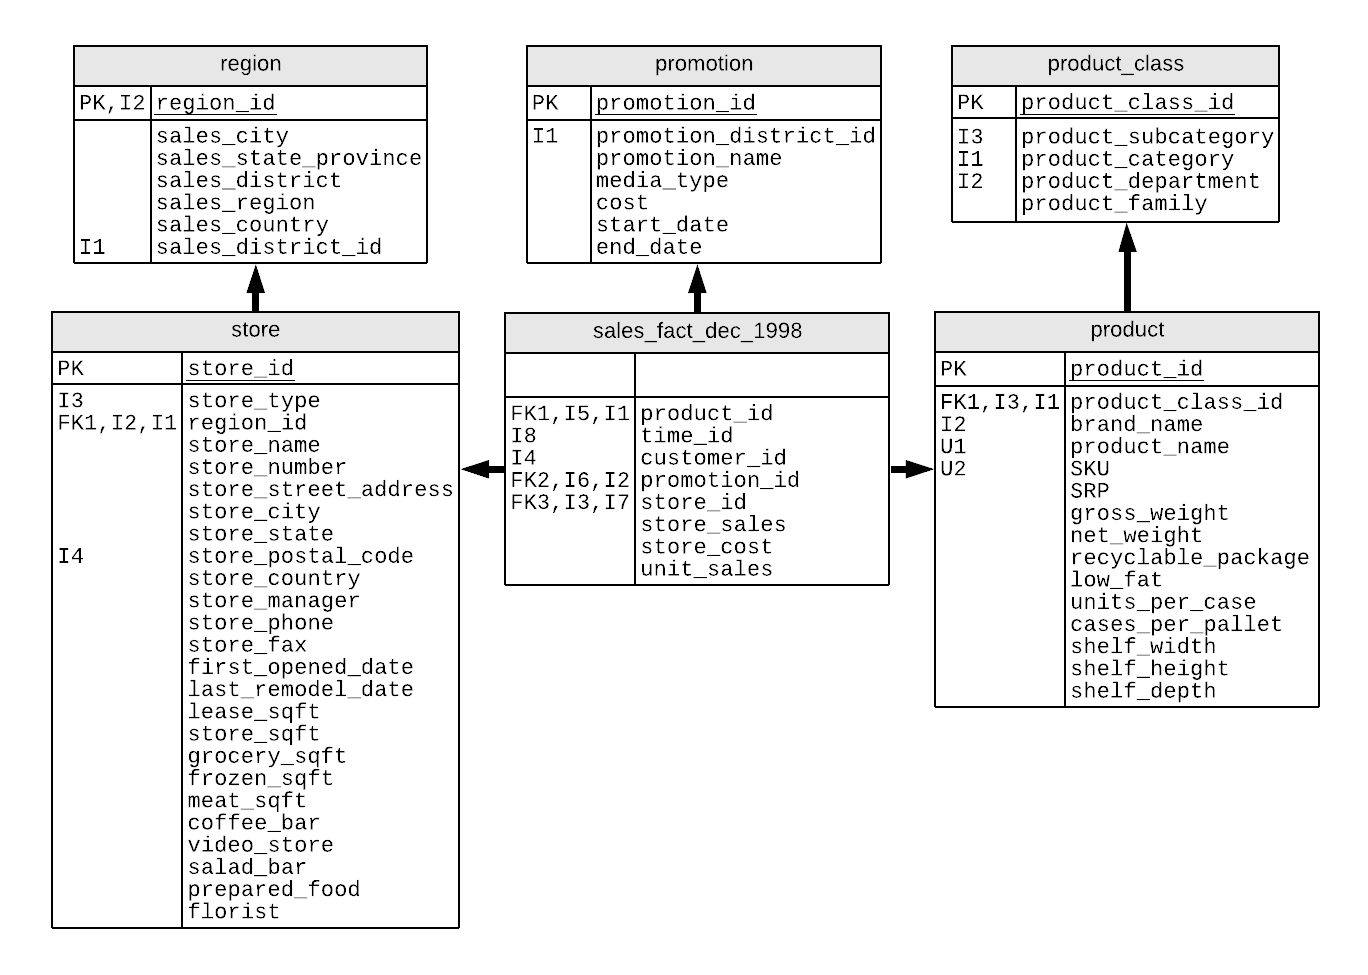
As we can see these are normal tables, having a primary key and some other fields.
.jrxml
jrxml, which stands for Jasper XML, contains report definitions in XML format. This type of file can be edited as code or visually to be compiled into .jasper files. The community provides samples that can be used and understood. Among them we can find a JFreeChart sample, which contains a jrxml file, a preview HTML and an actual PDF. The .jrxml file looks like this:
<?xml version="1.0" encoding="UTF-8"?>
<!DOCTYPE jasperReport PUBLIC "-//JasperReports//DTD Report Design//EN" "http://jasperreports.sourceforge.net/dtds/jasperreport.dtd">

<jasperReport name="JFreeChartReport" pageWidth="595" pageHeight="842" columnWidth="515" leftMargin="40" rightMargin="40" topMargin="50" bottomMargin="50" scriptletClass="JFreeChartScriptlet">
  <variable name="Chart" class="net.sf.jasperreports.engine.JRRenderable" calculation="System"/>
  <title>
    <band height="742">
      <line>
        <reportElement x="0" y="0" width="515" height="1"/>
        <graphicElement/>
      </line>
      <staticText>
        <reportElement x="0" y="10" width="515" height="30"/>
        <textElement textAlignment="Center">
          <font size="22"/>
        </textElement>
        <text><![CDATA[JFreeChart Sample]]></text>
      </staticText>
      <textField>
        <reportElement x="0" y="50" width="515" height="50"/>
        <textElement textAlignment="Center">
          <font size="12"/>
        </textElement>
        <textFieldExpression class="java.lang.String"><![CDATA["This sample uses JFreeChart Version 1.0.0-pre2\n" + "Written by David Gilbert (david.gilbert@object-refinery.com) and others.\n" + "(C)opyright 2000-2004, by Object Refinery Limited and Contributors."]]></textFieldExpression>
      </textField>
      <image scaleImage="Clip" hAlign="Center" hyperlinkType="Reference">
        <reportElement x="0" y="110" width="515" height="300"/>
        <graphicElement/>
        <imageExpression class="net.sf.jasperreports.engine.JRRenderable"><![CDATA[$V{Chart}]]></imageExpression>
        <hyperlinkReferenceExpression><![CDATA["http://www.jfree.org/jfreechart"]]></hyperlinkReferenceExpression>
      </image>
    </band>
  </title>
</jasperReport>
It starts with the xml tag, specifying that this file should be interpreted as XML. Then comes the DOCTYPE and finally the jasperReport node, which contains the actual report nodes. A variable is defined, called Chart, which is used later in the inner XML of the image node. A hyperlink is defined for the image. The preview for this report looks like this:
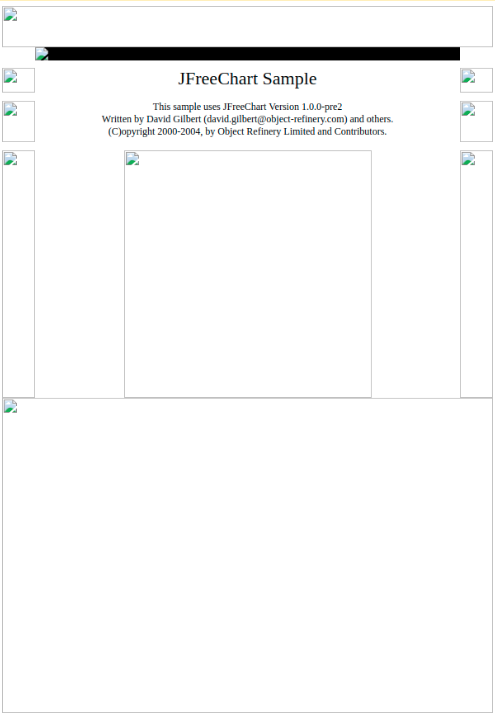
Don’t worry about the broken images; this is just the preview, the actual result looks like this:
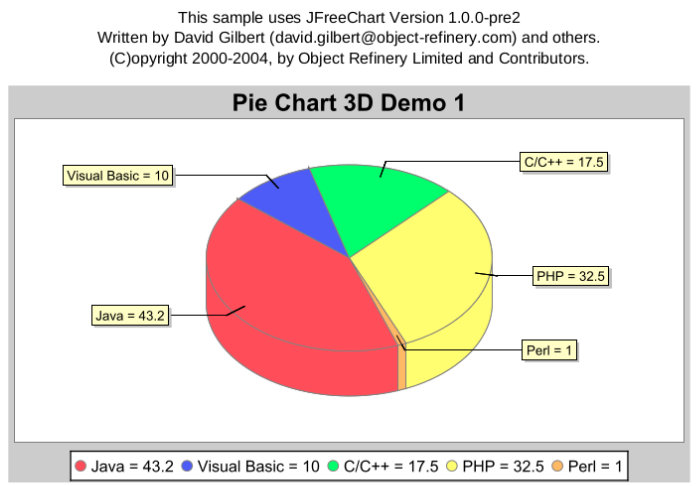
Nice, isn’t it?
Data source
It’s nice to generate reports, but in many cases the content is not fully known at programming time. It’s quite possible that we need to provide some input for the template. For this purpose, the interface of JRDataSource was defined to be iterated with a .next() method and is readable via the .getFieldValue() method. To make sure that we can read fields, another interface, JRField was defined as well. We therefore will need to use implementations of these classes, possibly writing our own if the currently available implementations are not fulfilling our needs.
Let’s consider a datasource sample, also taken from the community. It has this .jrxml template:
<?xml version="1.0" encoding="UTF-8"?>
<!DOCTYPE jasperReport PUBLIC "-//JasperReports//DTD Report Design//EN" "http://jasperreports.sourceforge.net/dtds/jasperreport.dtd">

<jasperReport name="DataSourceReport" pageWidth="595" pageHeight="842" columnWidth="515" leftMargin="40" rightMargin="40" topMargin="50" bottomMargin="50">
  <style name="Arial_Normal" isDefault="true" fontName="Arial" fontSize="12" isBold="false" isItalic="false" isUnderline="false" isStrikeThrough="false" pdfFontName="Helvetica" pdfEncoding="Cp1252" isPdfEmbedded="false"/>
  <style name="Arial_Bold" isDefault="false" fontName="Arial" fontSize="12" isBold="true" isItalic="false" isUnderline="false" isStrikeThrough="false" pdfFontName="Helvetica-Bold" pdfEncoding="Cp1252" isPdfEmbedded="false"/>
  <style name="Arial_Italic" isDefault="false" fontName="Arial" fontSize="12" isBold="false" isItalic="true" isUnderline="false" isStrikeThrough="false" pdfFontName="Helvetica-Oblique" pdfEncoding="Cp1252" isPdfEmbedded="false"/>
  <parameter name="ReportTitle" class="java.lang.String"/>
  <parameter name="DataFile" class="java.lang.String"/>
  <field name="id" class="java.lang.Integer"/>
  <field name="name" class="java.lang.String"/>
  <field name="street" class="java.lang.String"/>
  <field name="the_city" class="java.lang.String">
    <fieldDescription>me.me.city</fieldDescription>
  </field>
  <variable name="CityNumber" class="java.lang.Integer" incrementType="Group" incrementGroup="CityGroup" calculation="Count">
    <variableExpression><![CDATA[Boolean.TRUE]]></variableExpression>
  </variable>
  <group name="CityGroup" minHeightToStartNewPage="60">
    <groupExpression><![CDATA[$F{the_city}]]></groupExpression>
    <groupHeader>
    <band height="20">
      <textField evaluationTime="Group" evaluationGroup="CityGroup" bookmarkLevel="1">
        <reportElement mode="Opaque" x="0" y="5" width="515" height="15" backcolor="#c0c0c0" style="Arial_Bold"/>
        <box leftPadding="10" bottomBorder="1Point"/>
        <textFieldExpression class="java.lang.String"><![CDATA["  " + String.valueOf($V{CityNumber}) + ". " + String.valueOf($F{the_city})]]></textFieldExpression>
        <anchorNameExpression><![CDATA[String.valueOf($F{the_city})]]></anchorNameExpression>
      </textField>
    </band>
    </groupHeader>
    <groupFooter>
    <band height="20">
      <staticText>
        <reportElement x="400" y="1" width="60" height="15" style="Arial_Bold"/>
        <textElement textAlignment="Right"/>
        <text><![CDATA[Count :]]></text>
      </staticText>
      <textField>
        <reportElement x="460" y="1" width="30" height="15" style="Arial_Bold"/>
        <textElement textAlignment="Right"/>
        <textFieldExpression class="java.lang.Integer"><![CDATA[$V{CityGroup_COUNT}]]></textFieldExpression>
      </textField>
    </band>
    </groupFooter>
  </group>
  <title>
    <band height="70">
      <line>
        <reportElement x="0" y="0" width="515" height="1"/>
        <graphicElement/>
      </line>
      <textField isBlankWhenNull="true" bookmarkLevel="1">
        <reportElement x="0" y="10" width="515" height="30" style="Arial_Normal"/>
        <textElement textAlignment="Center">
          <font size="22"/>
        </textElement>
        <textFieldExpression class="java.lang.String"><![CDATA[$P{ReportTitle}]]></textFieldExpression>
        <anchorNameExpression><![CDATA["Title"]]></anchorNameExpression>
      </textField>
      <textField isBlankWhenNull="true">
        <reportElement x="0" y="40" width="515" height="20" style="Arial_Normal"/>
        <textElement textAlignment="Center">
          <font size="14"/>
        </textElement>
        <textFieldExpression class="java.lang.String"><![CDATA[$P{DataFile}]]></textFieldExpression>
      </textField>
    </band>
  </title>
  <pageHeader>
    <band height="20">
      <rectangle>
        <reportElement x="0" y="5" width="515" height="15" forecolor="#333333" backcolor="#333333"/>
        <graphicElement/>
      </rectangle>
      <staticText>
        <reportElement mode="Opaque" x="0" y="5" width="55" height="15" forecolor="#ffffff" backcolor="#333333" style="Arial_Bold"/>
        <textElement textAlignment="Center"/>
        <text><![CDATA[ID]]></text>
      </staticText>
      <staticText>
        <reportElement mode="Opaque" x="55" y="5" width="205" height="15" forecolor="#ffffff" backcolor="#333333" style="Arial_Bold"/>
        <text><![CDATA[Name]]></text>
      </staticText>
      <staticText>
        <reportElement mode="Opaque" x="260" y="5" width="255" height="15" forecolor="#ffffff" backcolor="#333333" style="Arial_Bold"/>
        <text><![CDATA[Street]]></text>
      </staticText>
    </band>
  </pageHeader>
  <detail>
    <band height="15">
      <textField bookmarkLevel="2">
        <reportElement x="0" y="0" width="50" height="15"/>
        <box leftBorder="Thin" bottomBorder="Thin" leftPadding="10" rightPadding="10"/>
        <textElement textAlignment="Right"/>
        <textFieldExpression class="java.lang.Integer"><![CDATA[$F{id}]]></textFieldExpression>
        <anchorNameExpression><![CDATA[$F{name} + " (" + $F{id} + ")"]]></anchorNameExpression>
      </textField>
      <textField isStretchWithOverflow="true">
        <reportElement positionType="Float" x="50" y="0" width="200" height="15"/>
        <box leftBorder="Thin" bottomBorder="Thin" leftPadding="10" rightPadding="10"/>
        <textElement/>
        <textFieldExpression class="java.lang.String"><![CDATA[$F{name}]]></textFieldExpression>
      </textField>
      <textField isStretchWithOverflow="true">
        <reportElement positionType="Float" x="250" y="0" width="265" height="15"/>
        <box leftBorder="Thin" bottomBorder="Thin" rightBorder="Thin" leftPadding="10" rightPadding="10"/>
        <textElement/>
        <textFieldExpression class="java.lang.String"><![CDATA[$F{street}]]></textFieldExpression>
      </textField>
    </band>
  </detail>
  <pageFooter>
    <band height="40">
      <line>
        <reportElement x="0" y="10" width="515" height="1"/>
        <graphicElement/>
      </line>
      <textField>
        <reportElement x="200" y="20" width="80" height="15"/>
        <textElement textAlignment="Right"/>
        <textFieldExpression class="java.lang.String"><![CDATA["Page " + String.valueOf($V{PAGE_NUMBER}) + " of"]]></textFieldExpression>
      </textField>
      <textField evaluationTime="Report">
        <reportElement x="280" y="20" width="75" height="15"/>
        <textElement/>
        <textFieldExpression class="java.lang.String"><![CDATA[" " + String.valueOf($V{PAGE_NUMBER})]]></textFieldExpression>
      </textField>
    </band>
  </pageFooter>
  <lastPageFooter>
    <band height="60">
      <textField bookmarkLevel="1">
        <reportElement x="0" y="10" width="515" height="15"/>
        <textElement textAlignment="Center"/>
        <textFieldExpression class="java.lang.String"><![CDATA["There were " +
          String.valueOf($V{REPORT_COUNT}) +
          " address records on this report."]]></textFieldExpression>
        <anchorNameExpression><![CDATA["Summary"]]></anchorNameExpression>
      </textField>
      <line>
        <reportElement x="0" y="30" width="515" height="1"/>
        <graphicElement/>
      </line>
      <textField>
        <reportElement x="200" y="40" width="80" height="15"/>
        <textElement textAlignment="Right"/>
        <textFieldExpression class="java.lang.String"><![CDATA["Page " + String.valueOf($V{PAGE_NUMBER}) + " of"]]></textFieldExpression>
      </textField>
      <textField evaluationTime="Report">
        <reportElement x="280" y="40" width="75" height="15"/>
        <textElement/>
        <textFieldExpression class="java.lang.String"><![CDATA[" " + String.valueOf($V{PAGE_NUMBER})]]></textFieldExpression>
      </textField>
    </band>
  </lastPageFooter>
</jasperReport>
As we can see, there are fields defined like id, name, street, and the_city. We also have a group called CityGroup, so when the items from the data source are iterated through, their group is known via the_city. It’s worth looking at how the paging works. The key is evaluationTime, which is telling the engine to not evaluate a given element at iteration time, but rather when an event occurs. evaluationTime="Report" means that we need to evaluate the value when the Report event occurs. At that time $V{PAGE_NUMBER} already has the value equal to the number of pages. Let’s see the preview:
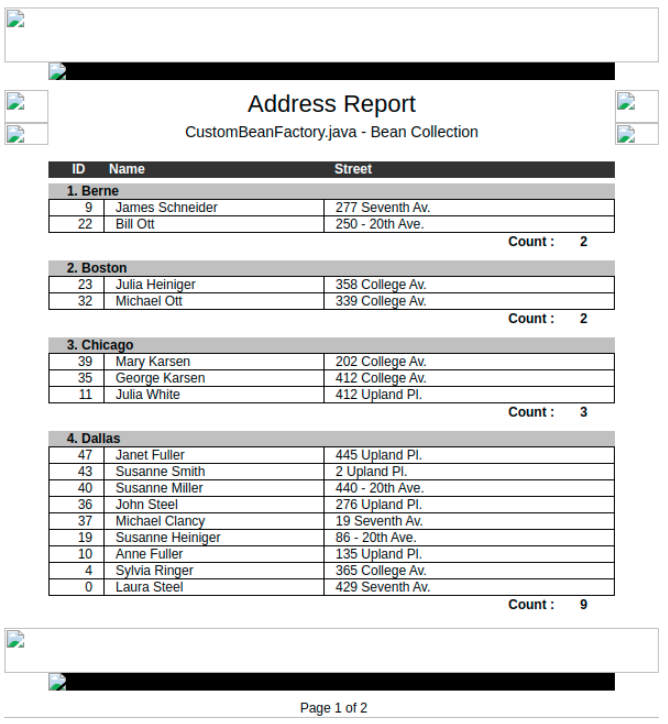
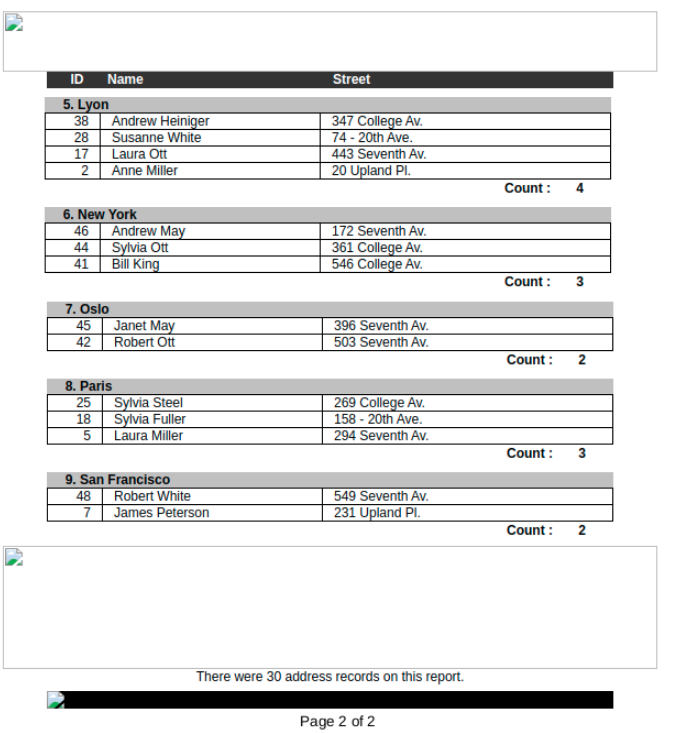
Again, we don’t need to worry about the missing image icons, since this is only a preview and this is the actual result:
Since we have a few interfaces that we need to respect, we can easily integrate Hibernate with our Jasper reports as data source, we just need to make sure we are using the field and data source interfaces they defined. Here we have a few examples, notably the following:
List cats = session.find("from eg.Cat");

Map parameters = new HashMap();
parameters.put("Title", "The Cat Report");

InputStream reportStream = this.class.getResourceAsStream("/the-cat-report.xml");
JasperDesign jasperDesign = JasperManager.loadXmlDesign(reportStream);
JasperReport jasperReport = JasperManager.compileReport(jasperDesign);

JRBeanCollectionDataSource ds = new JRBeanCollectionDataSource(cats);
JasperPrint jasperPrint = JasperManager.fillReport(jasperReport, parameters, ds);

JasperManager.printReportToPdfFile(jasperPrint, "the-cat-report.pdf");
We gather a List of Cat instances, then define some parameters, like Title, followed by the creation of an InputStream object which will be used to generate a JasperDesign object, which is then the input for the instantiation of JasperReport. Now, we define cats to be our data source and call fillReport, passing the jasperReport object we have just created, the parameters, which contain the title and the data source. Finally, we print the report to a PDF. Note that you can use a compiled .jasper file as input for getResourceAsStream.
TIBCO Jaspersoft Studio
This IDE is excellent for compiling the jrxml files into jasper files. I use it as a desktop application. There are three tabs:
- Design
- Source
- Preview
In the Design tab one can interactively design the report, not worrying about source code, XML, and the like, which enables non-programmers to work on report creation as well. Handling the variables, parameters and fields needs some algorithmic understanding, but nonetheless, code is generated interactively in a point-and-click manner. The designer cannot do everything we need, but the Source tab comes to the rescue if needed. Sometimes I do not even need to use the Source tab.
There’s still one problem: testing is a high-cost operation in the project I am using Jasper for. We need to build the .jasper files, but that’s low-cost. The higher cost is that we need to build the application that actually generates the Jasper reports in order to test and then deploy it with JBoss. Then the actual test in the application occurs, so a test takes more than a minute. Luckily there is a Preview tab, where I can more or less see whether it’s a good idea to invest time into building and deploying, or if we need to do some tweaking first.
Long story short
For more information, see Jaspersoft’s website.
JasperReports is free and open source. However, you have to pay a fee to consult the help documentation. It’s easily a competitor in quality with other reporting tools, which are less reasonably priced. When I first had to work with Jasper reports, I didn’t know anything about it, but was able to complete the tasks at hand in a few hours, which shows that getting into the Jasper universe isn’t too hard. One may have difficulty understanding .jrxml files at first, but trust me, it’s worth it.
If you are already using Java and want to generate reports, Jasper is a good candidate. It can periodically generate reports for you and even send them attached to an email to you. I couldn’t write better closing words than a poster I found:

* Domo plan pricing was found at yurbi.com.
Comments