Switching from Google Maps to Leaflet

By Juan Pablo Ventoso
March 23, 2019
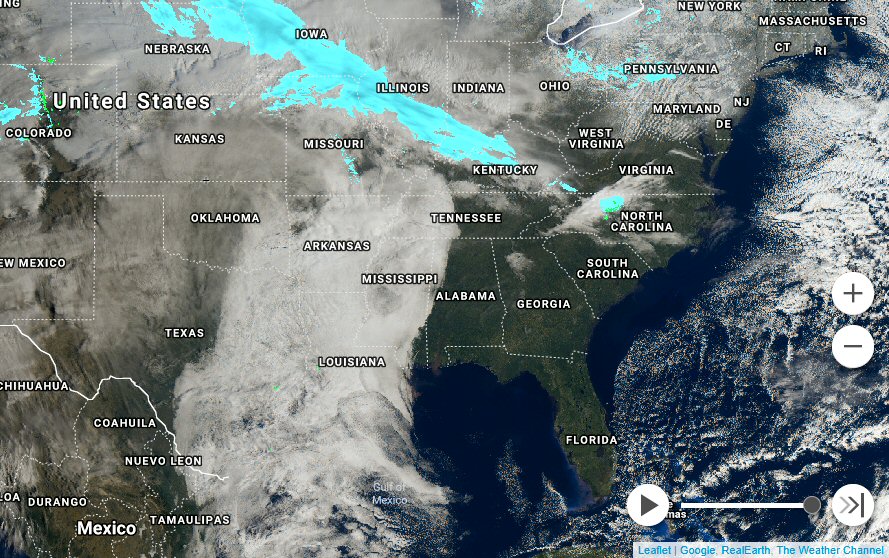
Photo: RadSat HD
It’s no news for anyone who has Google Maps running on their websites that Google started charging for using their API. We saw it coming when, back in 2016, they started requiring a key to add a map using their JavaScript API. And on June 11, 2018, they did a major upgrade to their API and billing system.
The consequence? Any website with more than 25,000 page loads per day will have to pay. And if you are using a dynamic map (a map with custom styling and/or content) you only have roughly 28,000 free monthly page loads. We must create a billing account, even if we have a small website with a couple of daily visitors, hand credit card information to Google, and monitor our stats to make sure we won’t be charged. And if we don’t do that, our map will be dark and will have a “For development only” message in the background.
So what are your options? You can either pay or completely remove Google Maps from your websites. Even enterprise weather websites like The Weather Channel or Weather Underground have now replaced their Google Maps API calls with an alternative like Leaflet or MapBox (in some cases, they even gained some functionality in the process).
I have a personal weather website, and when I heard big changes were coming, I started to move away from Google Maps as well. My choice at that moment was Leaflet: It has everything you may need to build a robust tile-based map, add layers, markers, animations, custom tiles, etc. And it’s BSD-licensed open source and free.
Creating a basic map
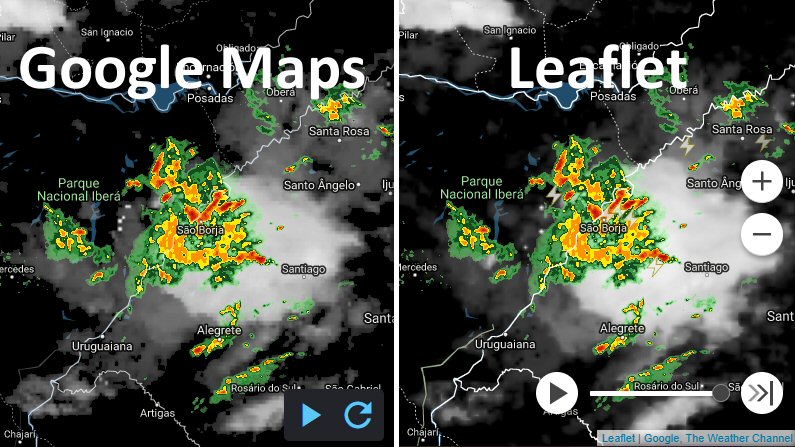
Google Map conversion to Leaflet can be almost seamless if the same tiles are used.
Google Maps API and Leaflet share a similar way of doing most things, but they have some key differences we need to take into account. As a general rule, Google used the “google.maps” prefix to name most classes and interfaces, while Leaflet uses the “L” prefix instead.
First thing we need to do is to remove the Google Maps API reference from our website(s). So we need to replace the reference:
<script type="text/javascript" src="https://maps.googleapis.com/maps/api/js?key=[your_api_key]"></script>With the references to the Leaflet map JavaScript and stylesheet URIs.
<script src="https://unpkg.com/leaflet@1.0.2/dist/leaflet.js"></script>
<link rel="stylesheet" href="https://unpkg.com/leaflet@1.0.2/dist/leaflet.css" />
Now let’s take a look at the code needed to create a Google Map vs. a Leaflet map.
- Google:
var map = new google.maps.Map(document.getElementById("map"), {
	center: new google.maps.LatLng(40.7401, -73.9891),
	zoom: 12,
	mapTypeId: google.maps.MapTypeId.ROADMAP
});
Leaflet:
var map = new L.Map("map", {
	center: new L.LatLng(40.7401, -73.9891),
	zoom: 12,
	layers: new L.TileLayer("https://tile.openstreetmap.org/{z}/{x}/{y}.png")
});
Quite similar, isn’t it? The main difference is that, in Leaflet, we need to provide a tile layer for the base map because there isn’t one by default. There are a lot of excellent tile layers available to use at no cost. Here are some of them:
- Bright:
https://a.tiles.mapbox.com/v3/mapbox.world-bright/{z}/{x}/{y}.png - Topographic:
https://{s}.tile.opentopomap.org/{z}/{x}/{y}.png - Black and white:
https://stamen-tiles-{s}.a.ssl.fastly.net/toner/{z}/{x}/{y}{r}.png
You can browse other free tile layer providers for Leaflet on this link. And of course, if you want to pay there’s a lot of affordable paid tiles out there too.
Adding a marker
Adding a marker is quite straightforward as well. It even looks easier on Leaflet than Google.
Google:
var marker = new google.maps.Marker({
	position: new google.maps.LatLng(40.7401, -73.9891),
	map: map,
	title: "End Point Corporation"
});
Leaflet:
var marker = new L.Marker(new L.LatLng(40.7401, -73.9891));
marker.bindPopup("End Point Corporation");
map.addLayer(marker);
And that’s it: we have a working Leaflet map with a marker that displays a text when we click on it.
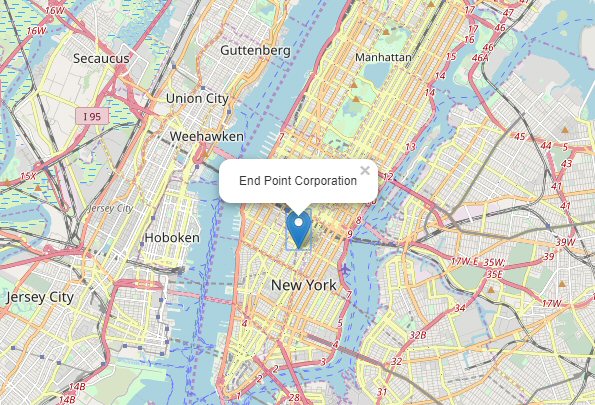
Screenshot of the Leaflet example. Code below, if you want to try it live:
<head>
  <title>Leaflet map example — End Point Corporation</title>
  <script src="https://unpkg.com/leaflet@1.0.2/dist/leaflet.js"></script>
  <link rel="stylesheet" href="https://unpkg.com/leaflet@1.0.2/dist/leaflet.css" />
</head>
<body>
  <style>
    body { margin: 0 };
    #map { height: 100% };
  </style>
  <div id="map"></div>
  <script type="text/javascript">
    var endPointLocation = new L.LatLng(40.7401, -73.9891);
    var map = new L.Map("map", {
      center: endPointLocation,
      zoom: 12,
      layers: new L.TileLayer("https://tile.openstreetmap.org/{z}/{x}/{y}.png")
    });
    var marker = new L.Marker(endPointLocation);
    marker.bindPopup("End Point Corporation");
    map.addLayer(marker);
  </script>
</body>
Layers and controls
From this point, we can start doing more complex things if we need to:
- Display images on the map: ImageOverlay.
- Display a custom tile layer: TileLayer.
- Draw polygons, rectangles, circles: Polygon - Rectangle - Circle.
- Display GeoJSON data on the map: GeoJSON.
You can browse the Leaflet API reference for further details.
Plugins and tools
There is some extended functionality in Google Maps that is not available in Leaflet by default unless we use a plugin. For example, if we want to add the “fullscreen” button to the top right corner, just as Google has it, or if we want to let the user draw polygons on top of the map, we’ll need to download and add the reference to the required plugins. Here is a list of the ones I’ve already used:
- “Fullscreen” button plugin: Leaflet.fullscreen.
- Vector drawing and editing plugin: Leaflet.draw.
- Heatmap plugin: Leaflet.heat.
You can find more plugins at the Leaflet GitHub account. And of course, you can (and should!) contribute to improve them.
There is also some alternatives to additional services offered by Google like geocoding or routing. They might have some limitations involved, so it would be wise to take a look at their usage policies first.
- Geocoding API: Nominatim.
- Routing: Project ORSM (free version has limited use).
More services can be found at switch2osm.org/other-uses.
Putting it all together
I’ve been using Leaflet for almost a year now in an interactive weather map originally made with the Google Maps API. Of course, I’ve had some minor hiccups along the way, but having full control of the source code and resources allows you to add functionality, fix things or even rewrite whatever you need.
The Leaflet source code is well organized, modularized and easy to understand. I’ve created custom grid layers using different tile sources, with different coordinate systems, animations with frame transitions, custom controls, clickable polygons, popups with dynamic content from AJAX calls, and more. And all works smoothly. So I recommend that you go ahead and start using Leaflet right away.
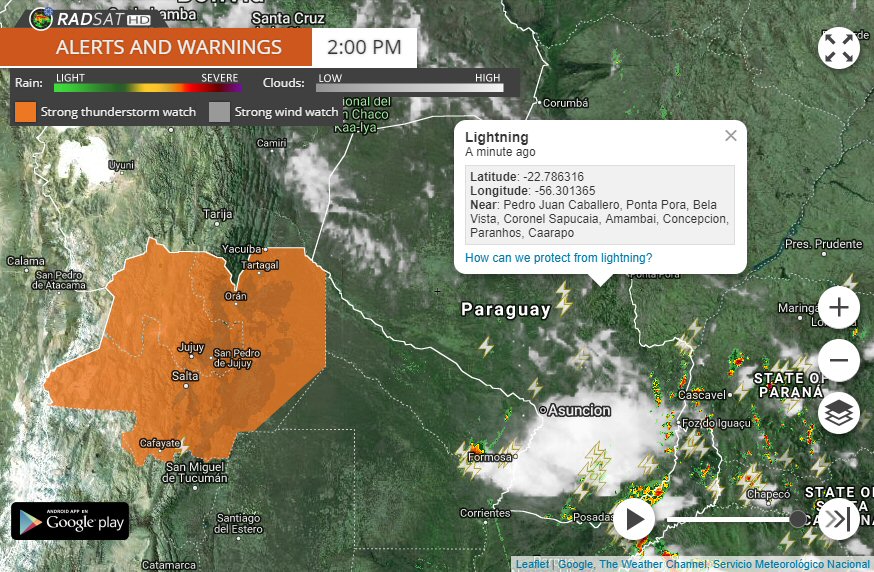
Example of a fully-functional Leaflet map with custom controls, overlays, animations and polygons.
And this is the repository with my weather map source code: RadSat HD. Feel free to leave any comments or suggestions!
leaflet open-source gis maps api
Comments