Profile Ruby with ruby-prof and KCachegrind

By Brian Buchalter
May 1, 2012
This week I was asked to isolate some serious performance problems in a Rails application. I went down quite a few paths to determine how to best isolate the issue. In this post I want to document what tools worked most quickly to help find offending code.
Benchmarks
Before any work begins finding how to speed things up, we need to set a performance baseline so we can know if we are improving things, and by how much. This is done with Ruby’s Benchmark class and some of Rail’s Benchmark class.
The Rails guides would have you setup performance tests, but I found this cumbersome on this Rails 2.3.5 application I was dealing with. Initial attempts to set it up were unfruitful, taking time away from the task at hand. In my case, the process of setting up the test environment to reflect the production environment was prohibitively expensive, but if you can automate the benchmarks, do it. If not, use the logs to measure your performance, and keep track in a spreadsheet. Regardless of benchmarking manually or automatically, you’ll want to keep some kind of log of the results keeping notes about what changed in each iteration.
Isolating the Problem
As always, start with your logs. In Rails, you get some basic performance information for free. Profiling code slows down runtime a lot. By reviewing the logs you can hopefully make a first cut at what needs to be profiled, reducing already long profile runs. For example, instead of having to profile an entire controller method, by reading the logs you might notice that it’s just a particular partial which is rendering slowly.
Taking a baseline benchmark
Once you’ve got a sense of where the pain is, it’s easy to get a benchmark for that slow code as a baseline.
module SlowModule
  def slow_method
    benchmark "SlowModule#slow_method" do
      #my slow code
    end
  end
end
Look to your log files to see results. If for some reason, you’re outside your Rails enviornment, you can use Ruby’s Benchmark class directly.
require 'benchmark'
result = Benchmark.ms do
  #slow code
end
puts result
This will tell you the process time in milliseconds and give you a precise measurement to compare against.
Profiling with ruby-prof
First, setup ruby-prof. Once installed, you can add these kinds of blocks around your code.
require 'ruby-prof'

module SlowModule
  def slow_method
    benchmark "SlowModule#slow_method" do
      RubyProf.start
      # your slow code here
      results = RubyProf.end
    end
    File.open "#{RAILS_ROOT}/tmp/SlowModule#slow_method_#{Time.now}", 'w' do |file|
      RubyProf::CallTreePrinter.new(results).print(file)
    end
  end
end
Keep in mind that profiling code will really slow things down. Make sure to collect your baseline both with profiling and without, to make sure you’re doing apples-to-apples comparison.
By default ruby-prof measures process time, which is the time used by a process between any two moments. It is unaffected by other processes concurrently running on the system. You can review the ruby-prof README for other types of measurements including memory usage, object allocations and garbage collection time.
If you choose to measure any of these options, make sure your Ruby installation has the tools a profiler needs to collect data. Please see the Rails guides for guidance on compiling and patching Ruby.
Interpreting the Data with KCachegrind
At this point you should have a general sense of what code is slow having reviewed the logs. You’ve got a benchmark log setup with baseline measurements to compare to. If you’re going to Benchmark while your profiling, make sure your baseline includes the profile code; it will be much slower! Remember we want an apples-to-apples comparison! You’re ready to start profiling and identifying the root source of the performance problems.
After manually or automatically running your troubled code with the profiling block above, you can open up the output from ruby-prof and quickly find it not to be human friendly. Fortunately, KCachegrind turns that mess into something very useful. I found that my Ubuntu installation had a package for it already built, so installation was a breeze. Hopefully things are as easy for you. Next simply open your result files and start reviewing there results.
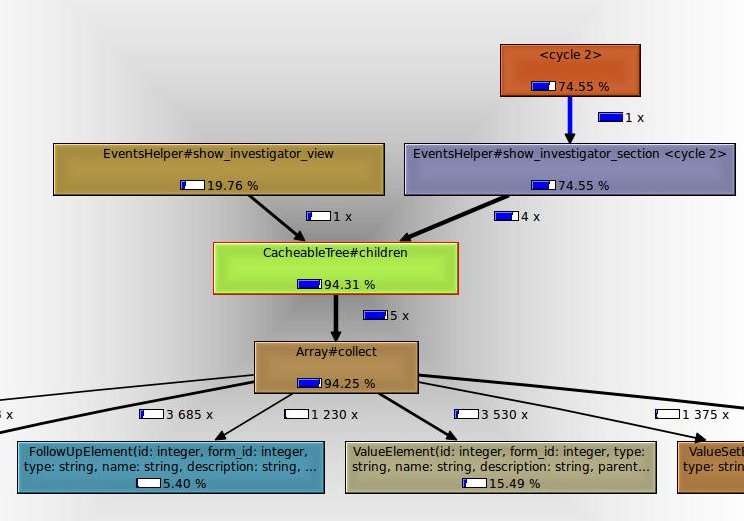
The image above shows what’s called a “call graph” with the percentages representing the relative amount of time that method uses for the duration of the profile run. The CacheableTree#children method calls Array#collect and takes up more then 90% of the runtime. The subsequent child calls are relatively modest in proportion. It’s clear we can’t modify Array#collect so let’s look at CacheableTree#children.
module CacheableTree
  def children(element = @root_element)
    full_set.collect { |node| if (node.parent_id == element.id)
      node
    }.compact
  end
end
Defined elsewhere, full_set is an array of Ruby objects. This is common performance optimization in Rails; collecting data looping through arrays works well with a small data set, but quickly becomes painful with a large one. It turned out in this case that full_set had 4200+ elements. Worse yet the children method was being called recusrively on each of them. Yikes!
At this point I had to decide how to optimize. I could go for broke and completely break the API and try and clean up the mess, or I could see if I could collect the data more quickly, some other way. I looked at how the full_set was defined and found I could modify that query to return a subset of elements rather easily.
module CacheableTree
  def children(element = @root_element)
    FormElement.find_by_sql(...) #the details aren't important
  end
end
By collecting the data directly via a SQL call, I was able to cut my benchmark by about 20%. Not bad for a single line change! Let’s see what the next profile told us.
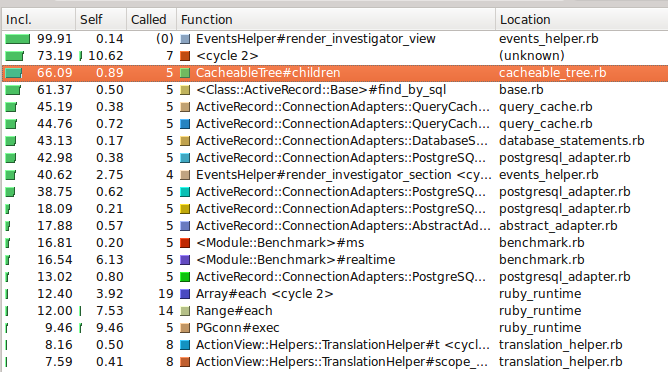
The above is another view of the profile KCachegrind provides. It’s essentially the same information, but in table format. There were a few indicators that my optimization was helpful:
- The total process_time cost had dropped
- The amount of time spent in each function seemed to better distributed—I didn’t have a single method soaking up all the process time
- Most of the time was spent in code wasn’t mine!
Although, we still saw 66% of time spent in the children method, we could also see that 61% of the time was spent in ActiveRecord::Base. Effectively, I had pushed the ‘slowness’ down the stack, which tends to mean better performance. Of course, there were LOTS of database calls being made. Perhaps some caching could help reduce the number of calls being made.
module CacheableTree
  def children(element = @root_element)
    @children ||= {}
    @children[element] ||= FormElement.find_by_sql(...) #the details aren't important
  end
end
This is called memoization and let’s us reuse this expensive method’s results within the page load. This method took another 10% off the clock against the baseline. Yay!
Knowing When to Stop
Performance optimization can be really fun, especially once all the infrastructure is in place. However, unless you have unlimited budget and time, you have to know when to stop. For a few lines of code changed, the client would see ~30% performance improvement. It was up to them to decide how much further to take it.
If allowed, my next step would be to make use of the applications existing dependence on redis, and add the Redis-Cacheable gem. It allows you to marshal Ruby objects in and out of a redis server. The application already makes extensive use of caching, and this page was no exception, but when the user modified the page in a way that expired the cache, we would hit this expensive method again, unnecessarily. Based on the call graph above, we could eliminate another ~66% of the call time, and perhaps, by pre-warming this cache, could help the user to minimize the chances of experiencing the pain of slow browsing!
Comments