A comparison of Jaspersoft iReport and Pentaho Reporting

By Josh Tolley
October 2, 2011
I’ve recently been involved in reporting projects using both Jaspersoft’s iReport and Pentaho’s Reporting, so this seemed a good opportunity to compare the two. Both are Java-based, open source reporting systems which claim to build “pixel-perfect” documents (“pixel-perfect” means that when you put something somewhere on a report design, it doesn’t move around. That this isn’t taken for granted is a rant for another time). I have more experience with Pentaho than with Jaspersoft, and once reviewed a book on Pentaho; I’ll try to give the two a fair evaluation, but in the end I can’t promise my greater experience with Pentaho won’t affect my conclusions one way or the other. Both suites are available in open source and commercial flavors; I’ll consider only the open source versions here.
First let me point out that Jaspersoft and Pentaho both produce business intelligence software suites. The two suites exist in both community (open source) and enterprise (commercial) forms, are well worth comparing in their entirety, but I’m focusing principally on the report builder component of each, because that’s where my recent experience has led me. These report builder packages allow users to build complex and visually interesting data-based documents from many different kinds of data sources. A “document” could be a simple form letter, an address book, or a complex dashboard of business metrics. In each case, users build documents by dragging and dropping various components into report “bands”, and then modifying components’ properties. “Bands” are horizontal sections of the page with different roles. The page header and footer bands, for instance, are (obviously) printed at the top and bottom of each page. “Detail” bands print once per row returned by the query that underlies the report. Both iReport and Pentaho Reporting will group and filter query results for you, if you want, and include header and footer bands for each group. Both products allow users to publish finished reports to a server where other users can view them, schedule them to run periodically, or modify them for new purposes, and both provide a Java-based reporting library to embed reporting in other applications.
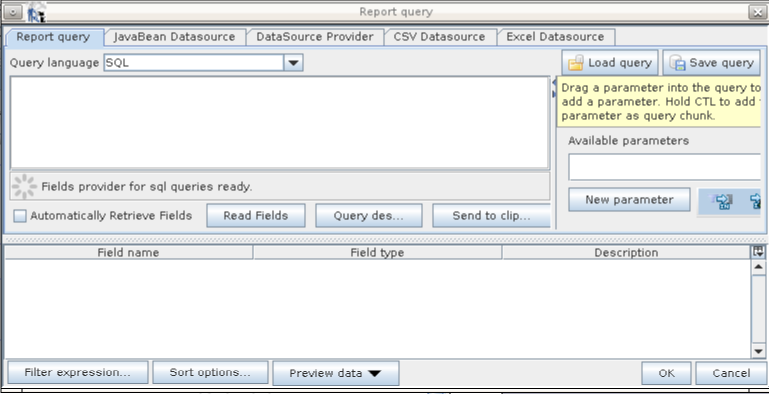
iReport Query Dialog
Reports in both products are based on queries. These queries may be SQL using JDBC data sources, or they can come from other more obscure data sources, such as MDX queries, XQuery, scripts in various languages, web services, and more. Both also provide a query editor, at least for SQL queries, and in fact, both use the same query editor. I’ve only used it rarely, and only in Pentaho; both products also allow users to type in queries free-form, which I much prefer. In Pentaho, the data source for the query is embedded in the report itself, in the form of a JDBC URL, a JNDI name, or something else appropriate for that data source, so if you publish the report to a server, you’re responsible for ensuring that JNDI name or JDBC URL or whatever makes sense on that server. Jasper, on the other hand, prompts the user with a list of available data sources when publishing a report to a server. Jasper’s method seems more friendly, but Pentaho’s choice may have its advantages here, because each report is self-contained, whereas Jasper’s reports have metadata outside the single report file to describe the associated data source.
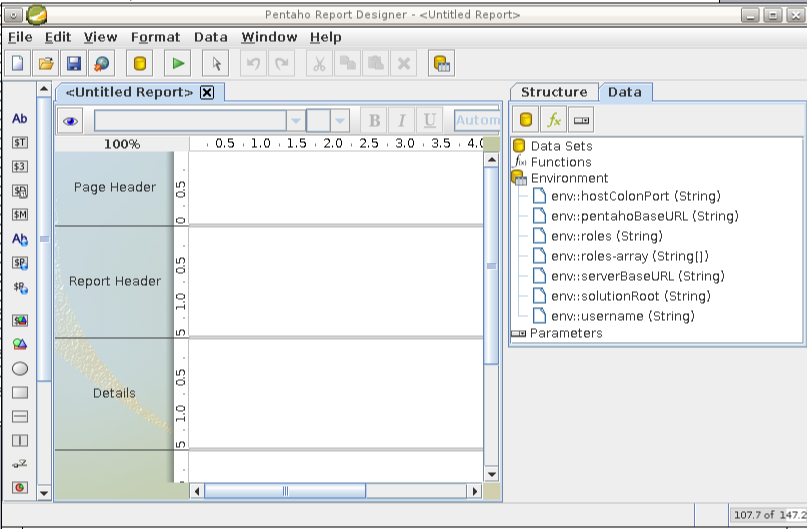
The Pentaho Report Builder
The component libraries available in each product are fairly similar. Users can select from basic drawing components such as lines and circles, static formatted text labels, and of course various numeric, textual, and date components to display query results. Both products also include complex charting components, to display visualizations of many different kinds. Though the charting functionality of both products, at least at the basic level I’ve used, is quite similar, I found iReport’s charting dialogs quite helpful for making complex charts much easier to create than they would otherwise be. In Pentaho, after adding a chart component the user can open a special properties window, but the window offers few clues beyond the usual tooltips and occasionally meaningful property names to help the user know what to do. In contrast, iReport describes many of the properties involved in clear language.
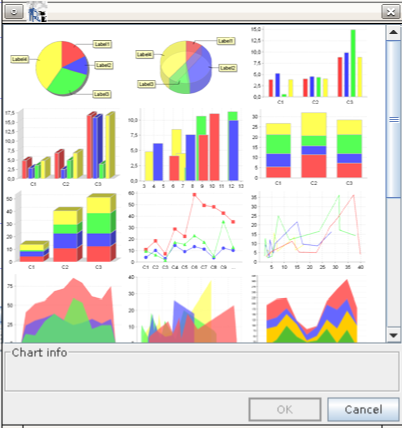
iReport’s chart selection dialog
This brings me to the topic of documentation, which, in fact, I found lacking for both produts. Yes, these are open source projects, and yes, documentation isn’t always as fun to write as code, so yes, open source projects sometimes end up with lousy documentation. The enterprise versions come with documentation in one form or another, and there are several books published on the different suites’ components, including reporting. But the documentation available free-of-charge on the web left me unimpressed. Here Pentaho was particularly frustrating, largely because Pentaho’s reporting has changed a great deal from version to version, especially with its 3.5 release a couple years ago, so much of the help available in forums and wikis is completely out of date. Jasper documentation was more difficult to find, in general, but more accurate and up-to-date when I found it.
Both products save their results in fairly comprehensible formats, which is helpful if you ever need to modify them by hand, without the help of the report building tool. iReport’s files are in a single XML file; Pentaho creates a ZIP-ed archive of several XML files. That fact has come in quite handy several times, both with Pentaho and with iReport, typically because it’s faster for me to edit XML by hand than click on each of 20 components and tweak properties one-by-one, because (in Pentaho) I needed to modify a data source, or because the tool failed to figure out what columns to expect from a query and I wanted to enter them manually.
One major difference between the two products stems from what is available in their open source “community editions”. Jasper looks a bit more polished to me, the documentation is somewhat more consistent, and its selection of sample reports and sample code is more comprehensive—but the community edition does little more than support iReport. Pentaho’s community edition, in addition to the reporting functions I’ve discussed, also offers ad-hoc web based reporting and a powerful MDX analysis package. Jaspersoft offers those features only in its enterprise edition. That may not be a big deal in some places, but it is the deciding factor in others. Having access to Pentaho’s code has made possible a number of things we certainly couldn’t have done otherwise.
I’ve been trying to keep this “a comparison” of Pentaho Reporting and iReport, rather than a “showdown” or “shootout” or even “Jasper vs. Pentaho”, but at some point, conclusions must be drawn. I’ll draw here somewhat on evidence not mentioned above, because, well, the post was getting a bit long as it was, and I didn’t want to describe everything. I admit to liking iReport’s interface better, because to me it seems to make better use of screen real estate. Google was much better able to answer questions for iReport than for Pentaho. But, although both products sometimes seem to make simple things hard, Pentaho seemed to do this less than iReport, and the various magic incantations I needed to get things working were fewer in Pentaho. In the end, the much greater capability of Pentaho’s open source offering over Jaspersoft’s clinches it for me. I’ll take open source over closed any day.
analytics database open-source reporting pentaho casepointer
Comments