New Cesium KML-CZML Editor Features: Custom Data & Styling, Google 3D Tiles, and More

By Dmitry Kiselev
June 13, 2025
I have made some updates to the Cesium KML-CZML editor I created and maintain.
The most important additions and changes are:
- Support for Google 3D tiles
- Support for writing many more features, including interpolation and time series data for some properties. There are still no editing capabilities for these properties, but while previously the editor would strip these values from the data, it will now copy them into the output file.
- Export to KML and KMZ
- Support for custom data and styling using that custom data
- Switched frontend framework from Vue to React
Adding support for Google 3D tiles is what caused me to create this major version update. In a nutshell, Cesium has its own way of adding reactivity to Entities and Vue doesn’t always play nice with it. If I add Google 3D tiles to the scene, it looks like that Cesium Entities have some references to the scene and that causes Vue to apply reactive getters and setters to the whole scene.
So, I’ve switched to using React because it’s easier to control which parts should be reactive, as well as when and how you update Cesium Entities and UI components.
The next important piece is the CZML exporter. The main issue here is that I don’t want to strip away features even if I don’t support editing them.
Even if I don’t have the UI to edit certain properties or animations for properties, a user can load a CZML document with a mixture of supported and unsupported features without losing the unsupported features. That means that the exporter should be more robust and feature complete than editor itself.
I will probably separate the exporter as standalone package because it is valuable on its own — I couldn’t find a way to export Cesium entities as CZML within the library.
Custom data & styling
This part is my favorite. I have some experience creating maps, and when you are working with maps you are not focused on polygons or billboards, you are focused on the data, while graphics are just a tool to represent it.
The previous iteration of the KML-CZML editor was more oriented toward importing KML and massaging it to have the same look in Cesium as it would in Google Earth. That puts focus on graphical features. This time I wanted to make it easy to edit data and style things based on the data.
Demo
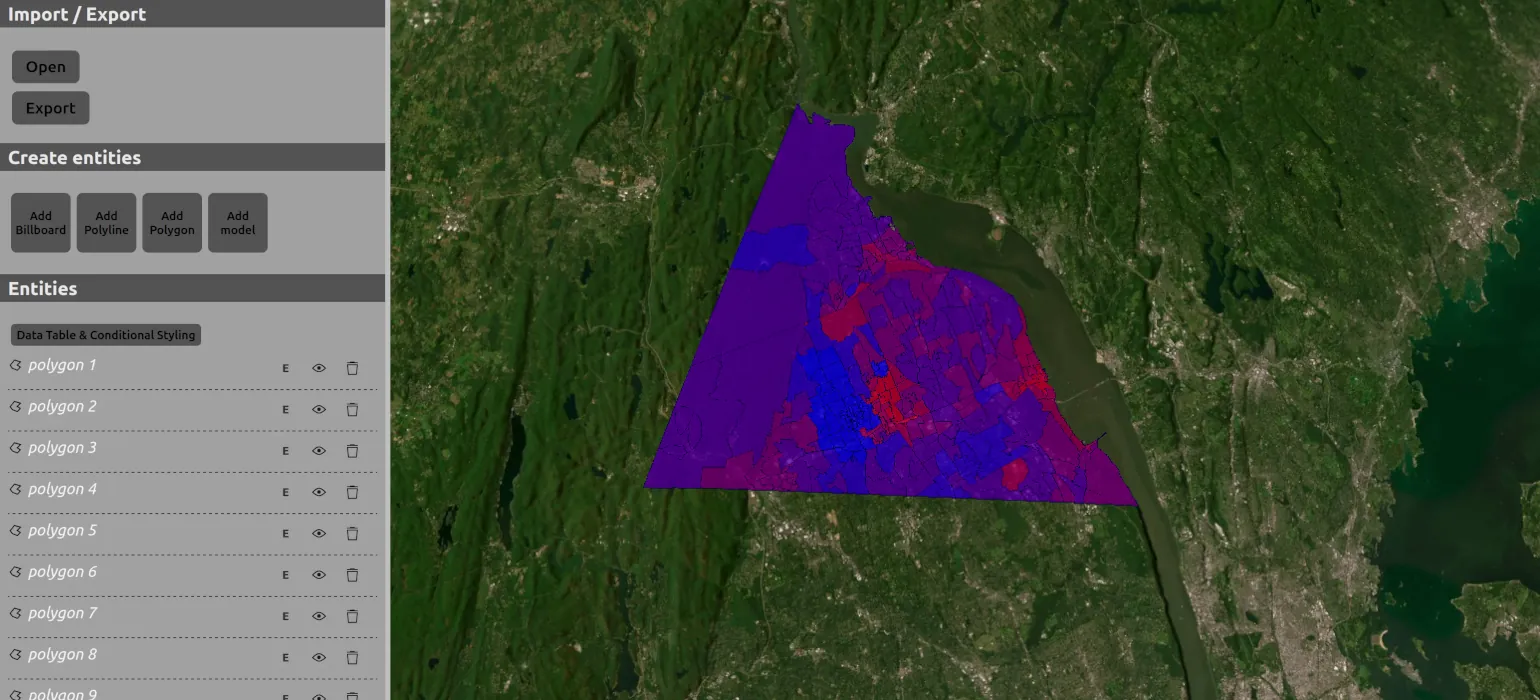
We’ll load in some demo data from New York elections in Mike4326.geojson.
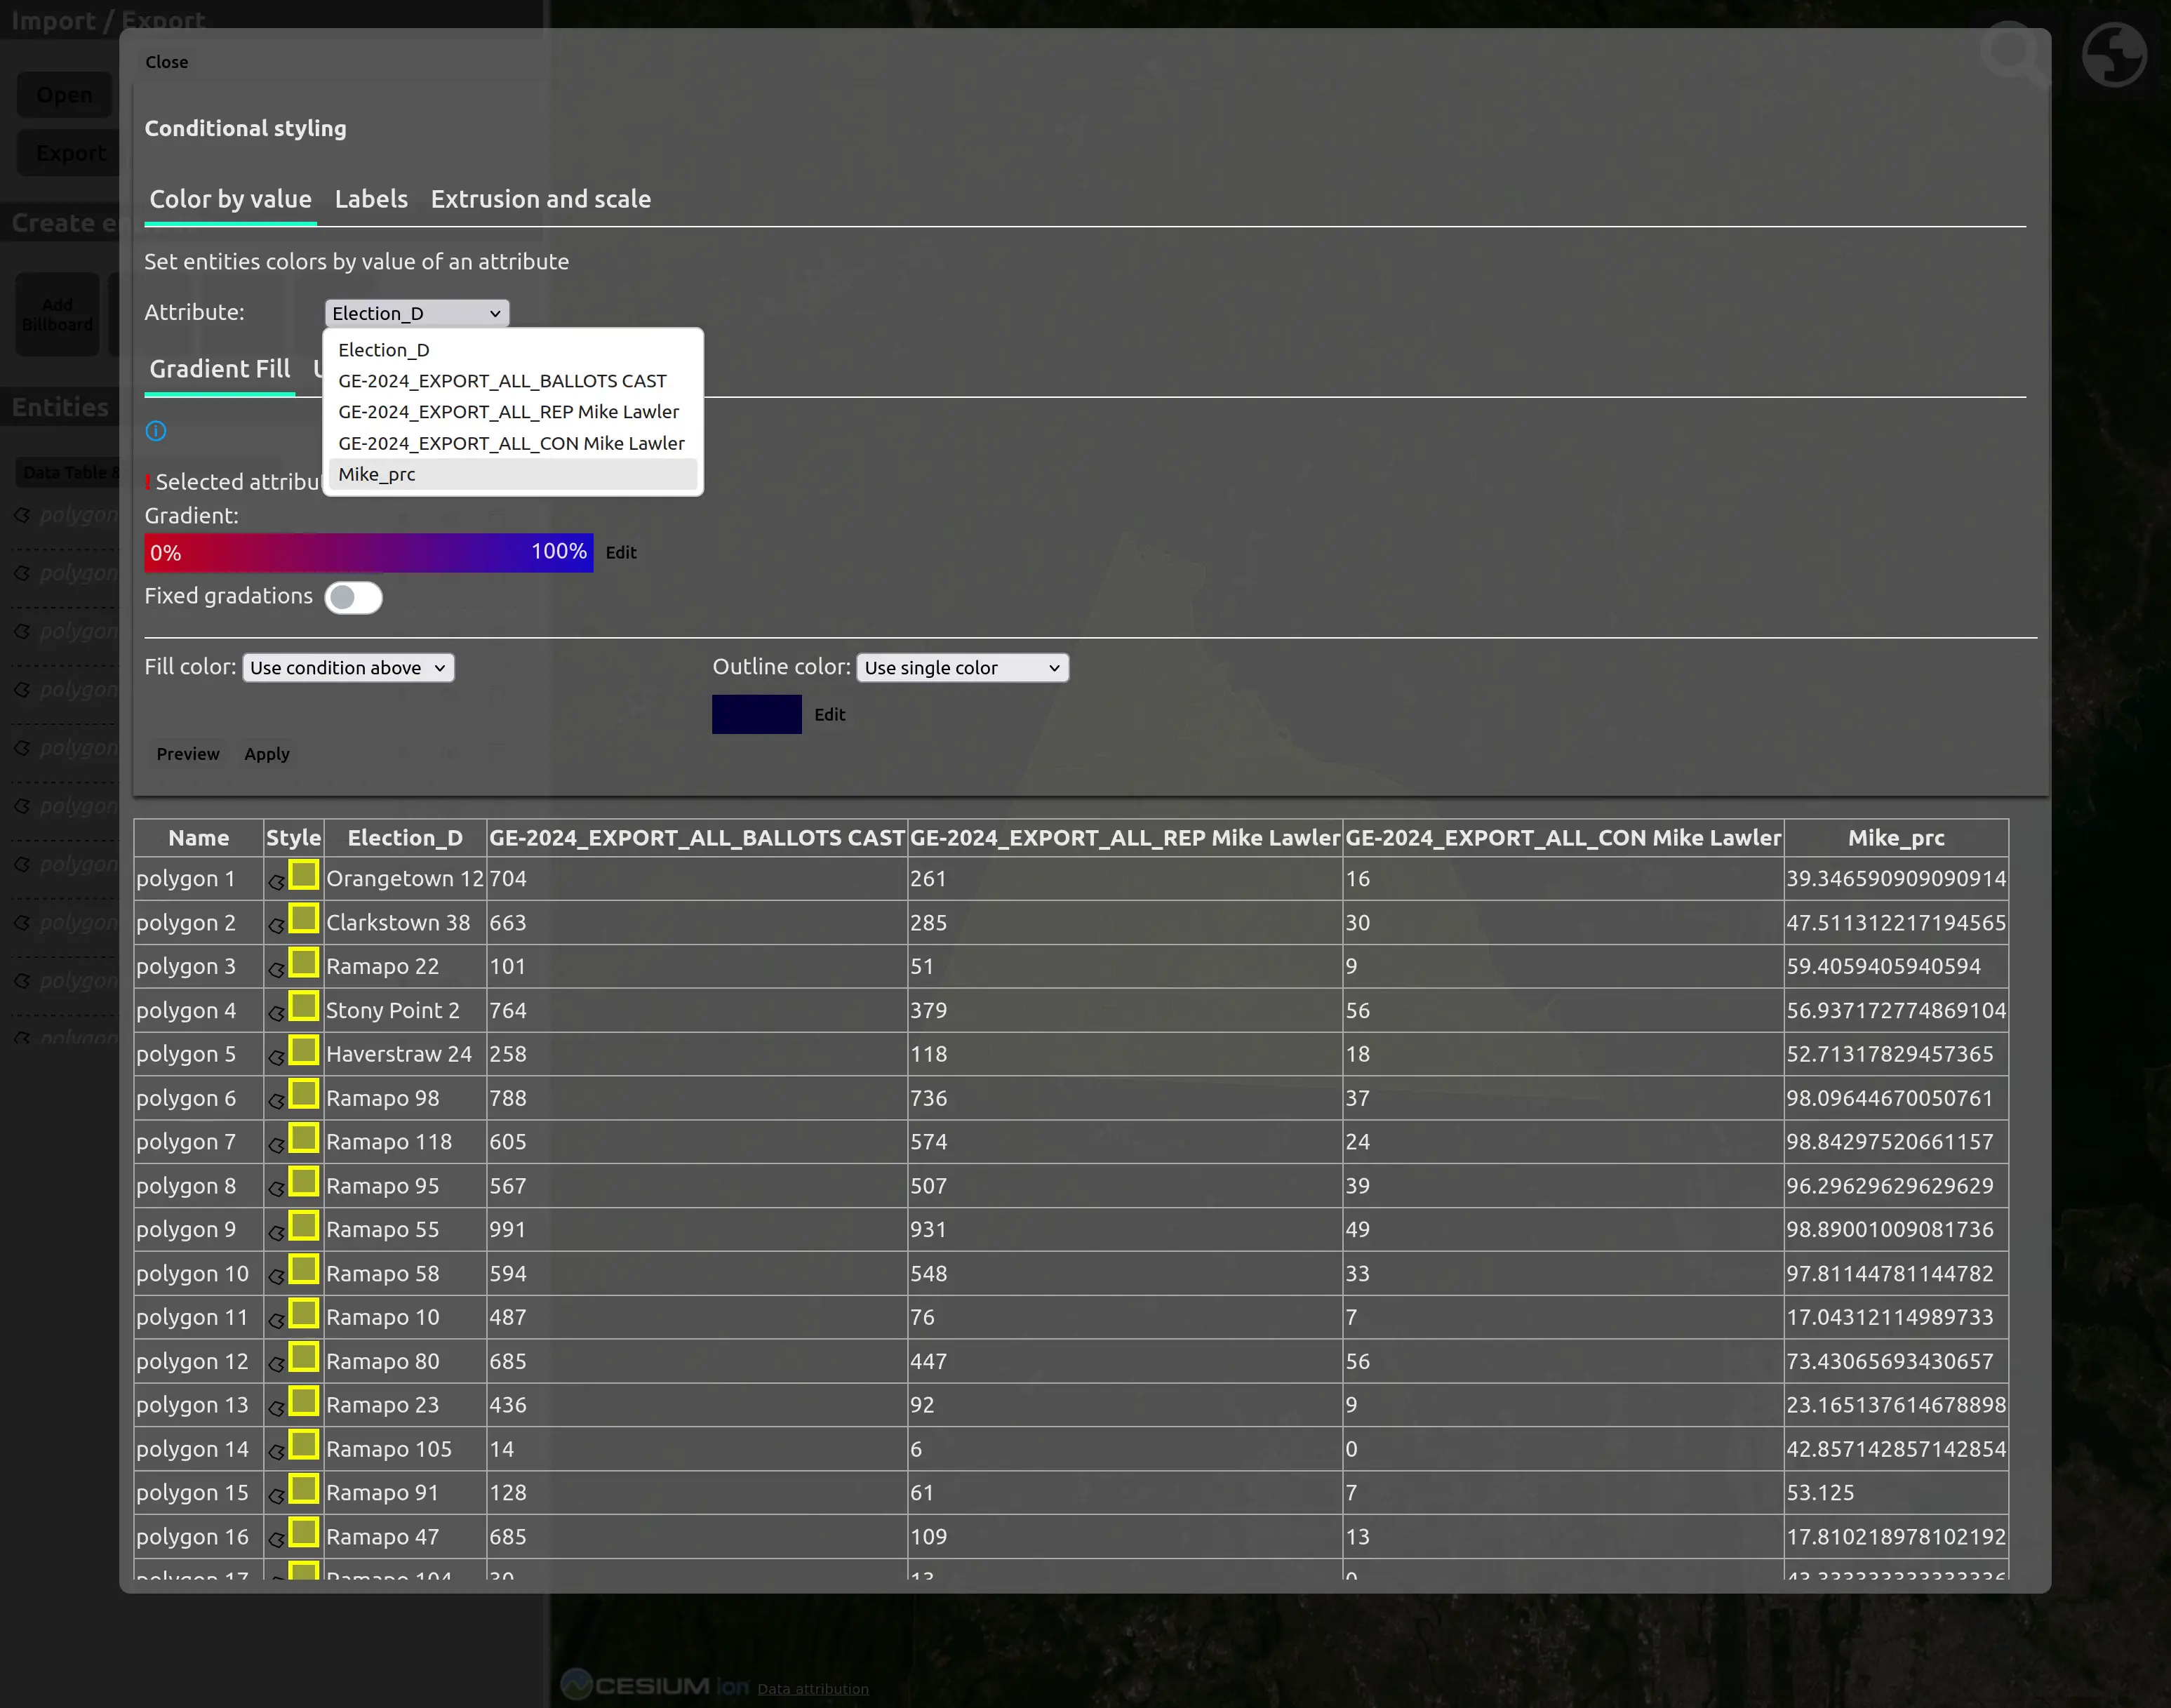
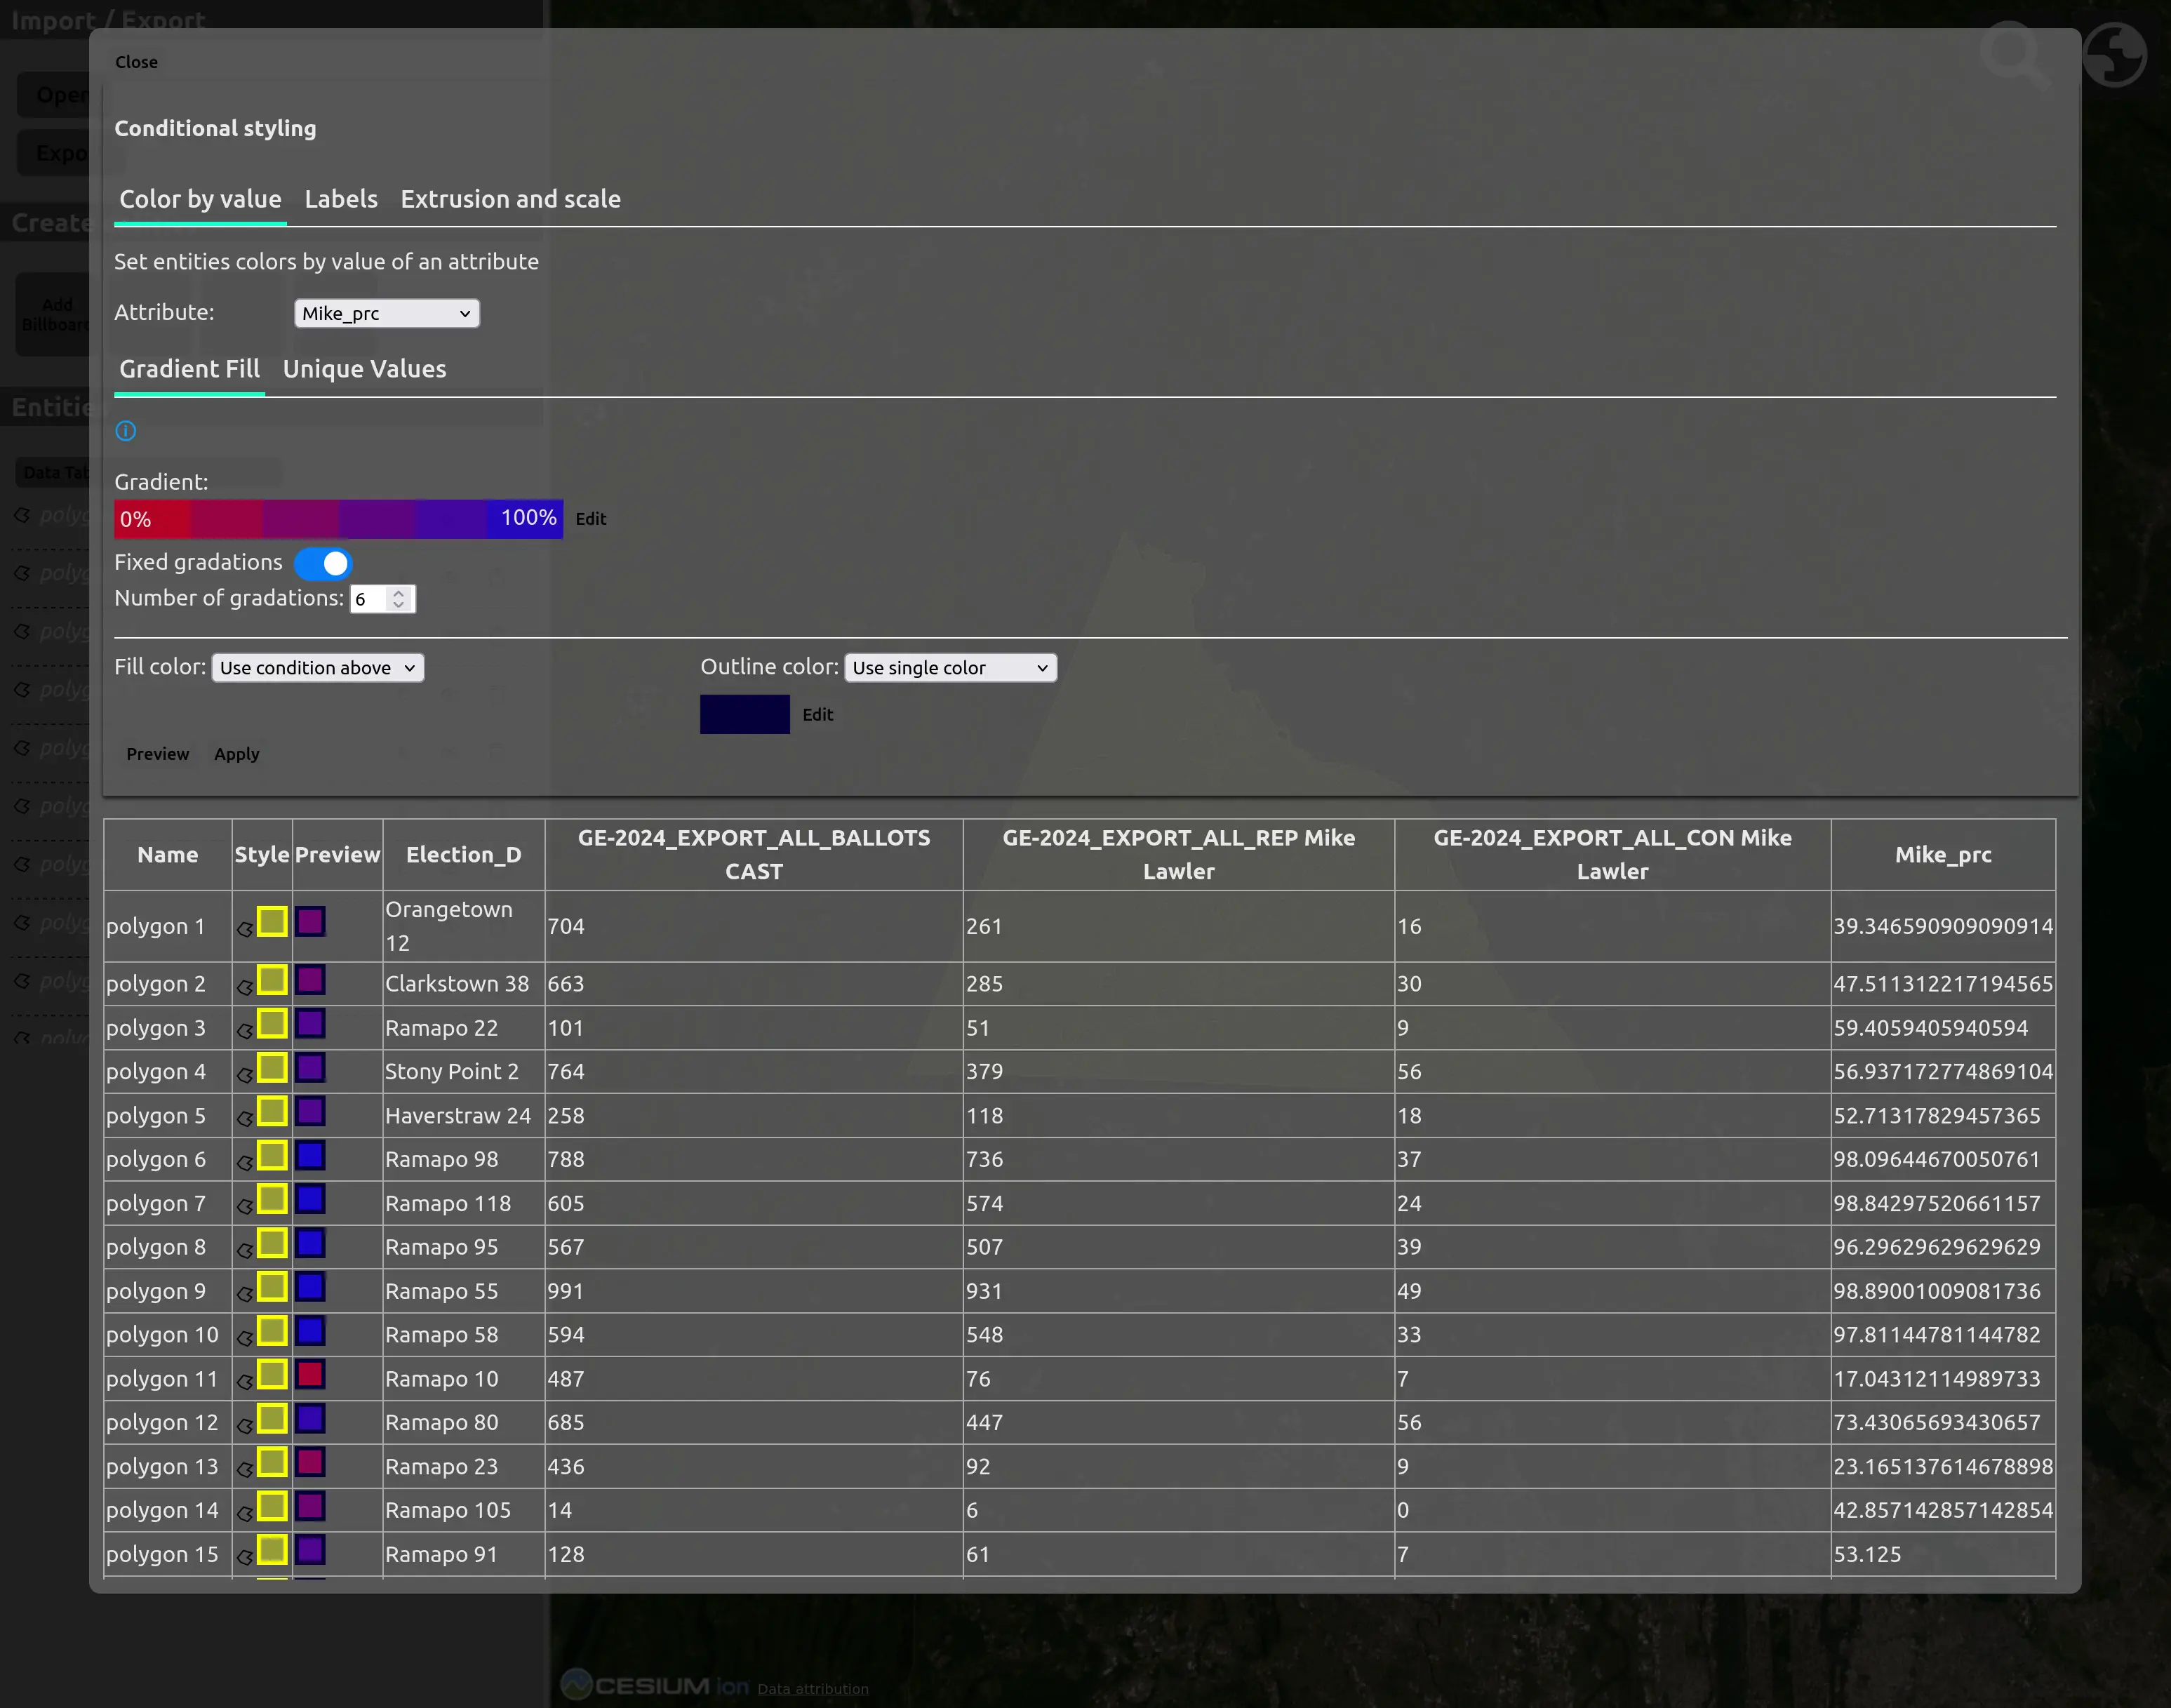
From here, we’ll click on the “Data table & Conditional Styling” button. Then, in the menu that opens, we’ll set up Color by value so that we can display different regions differently by our selected attribute. Note the “Mike_prc” column which displays a percent value. The app will select a color from the gradient based on this value.The app will select a color from the gradient based on this value.
To group values together, we’ll toggle the “Fixed gradations” switch. Then hit the “Preview” button. By default, there are 9 gradations.
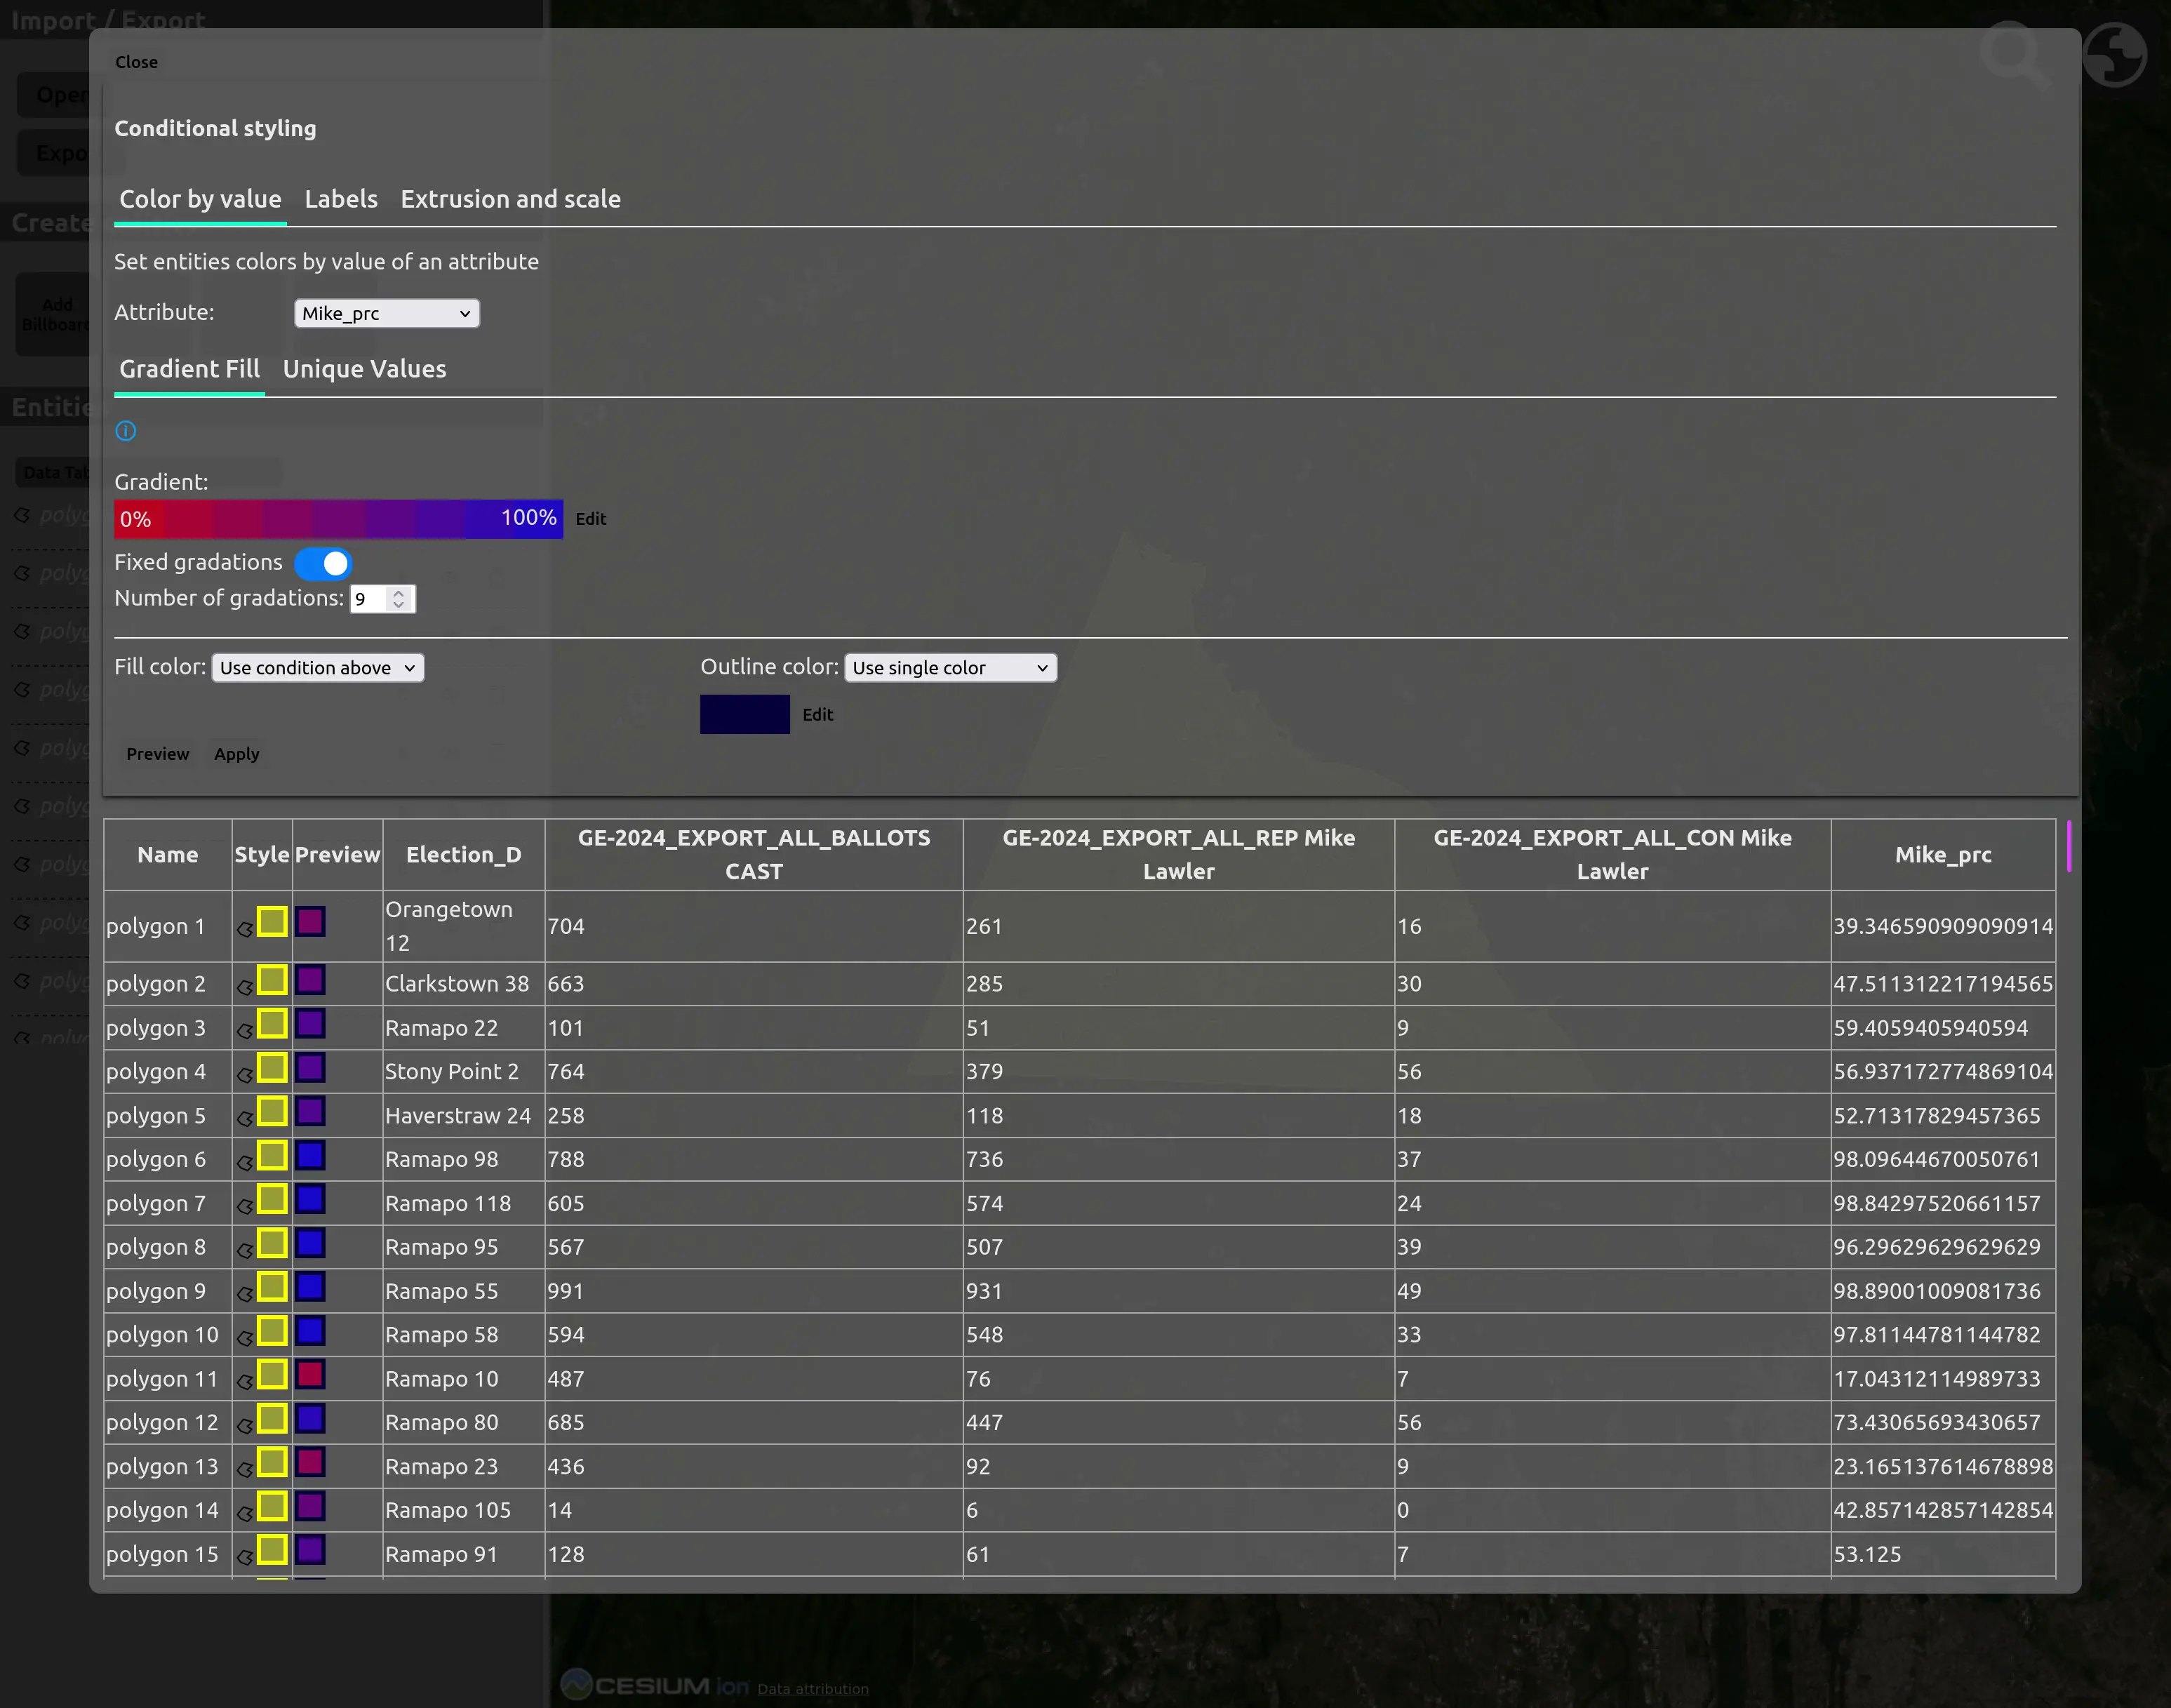
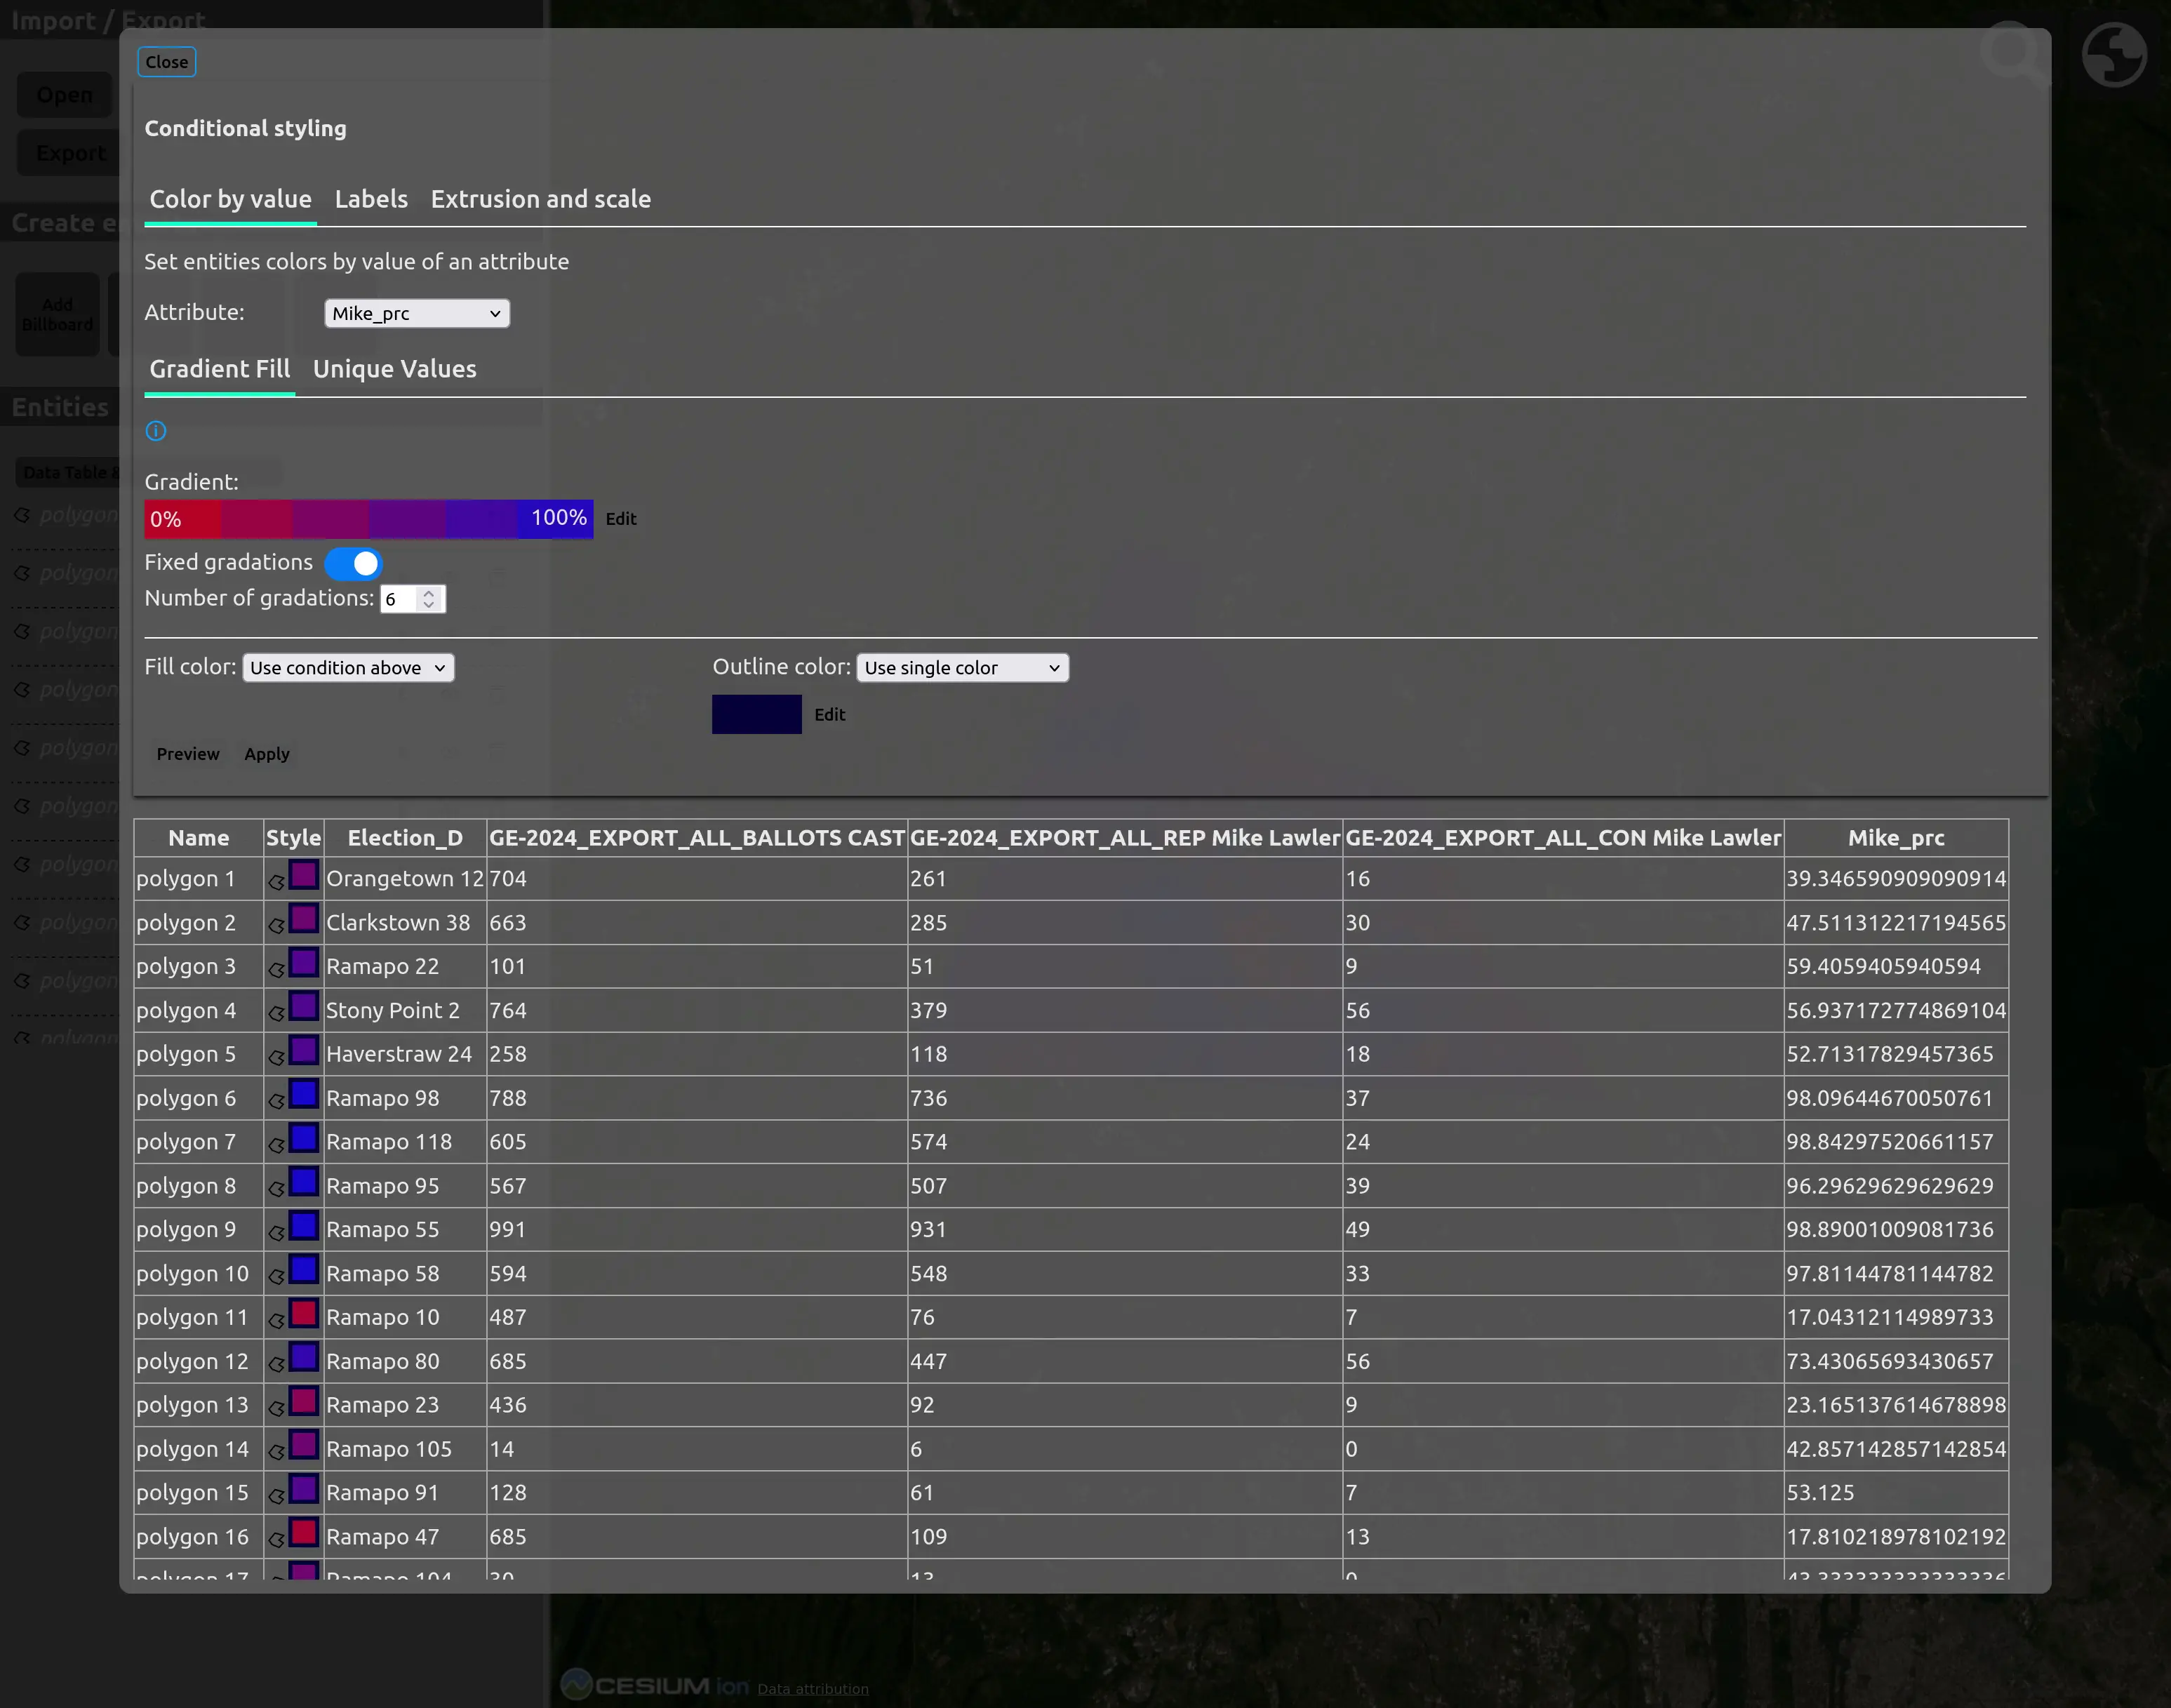
We want fewer gradations than that. Let’s try out 6.
Not much difference, but we’ll go with the 6 gradations. I’ll hit apply, and you can see the colors are now displayed in the “Style” column, while the “Preview” column has been hidden.
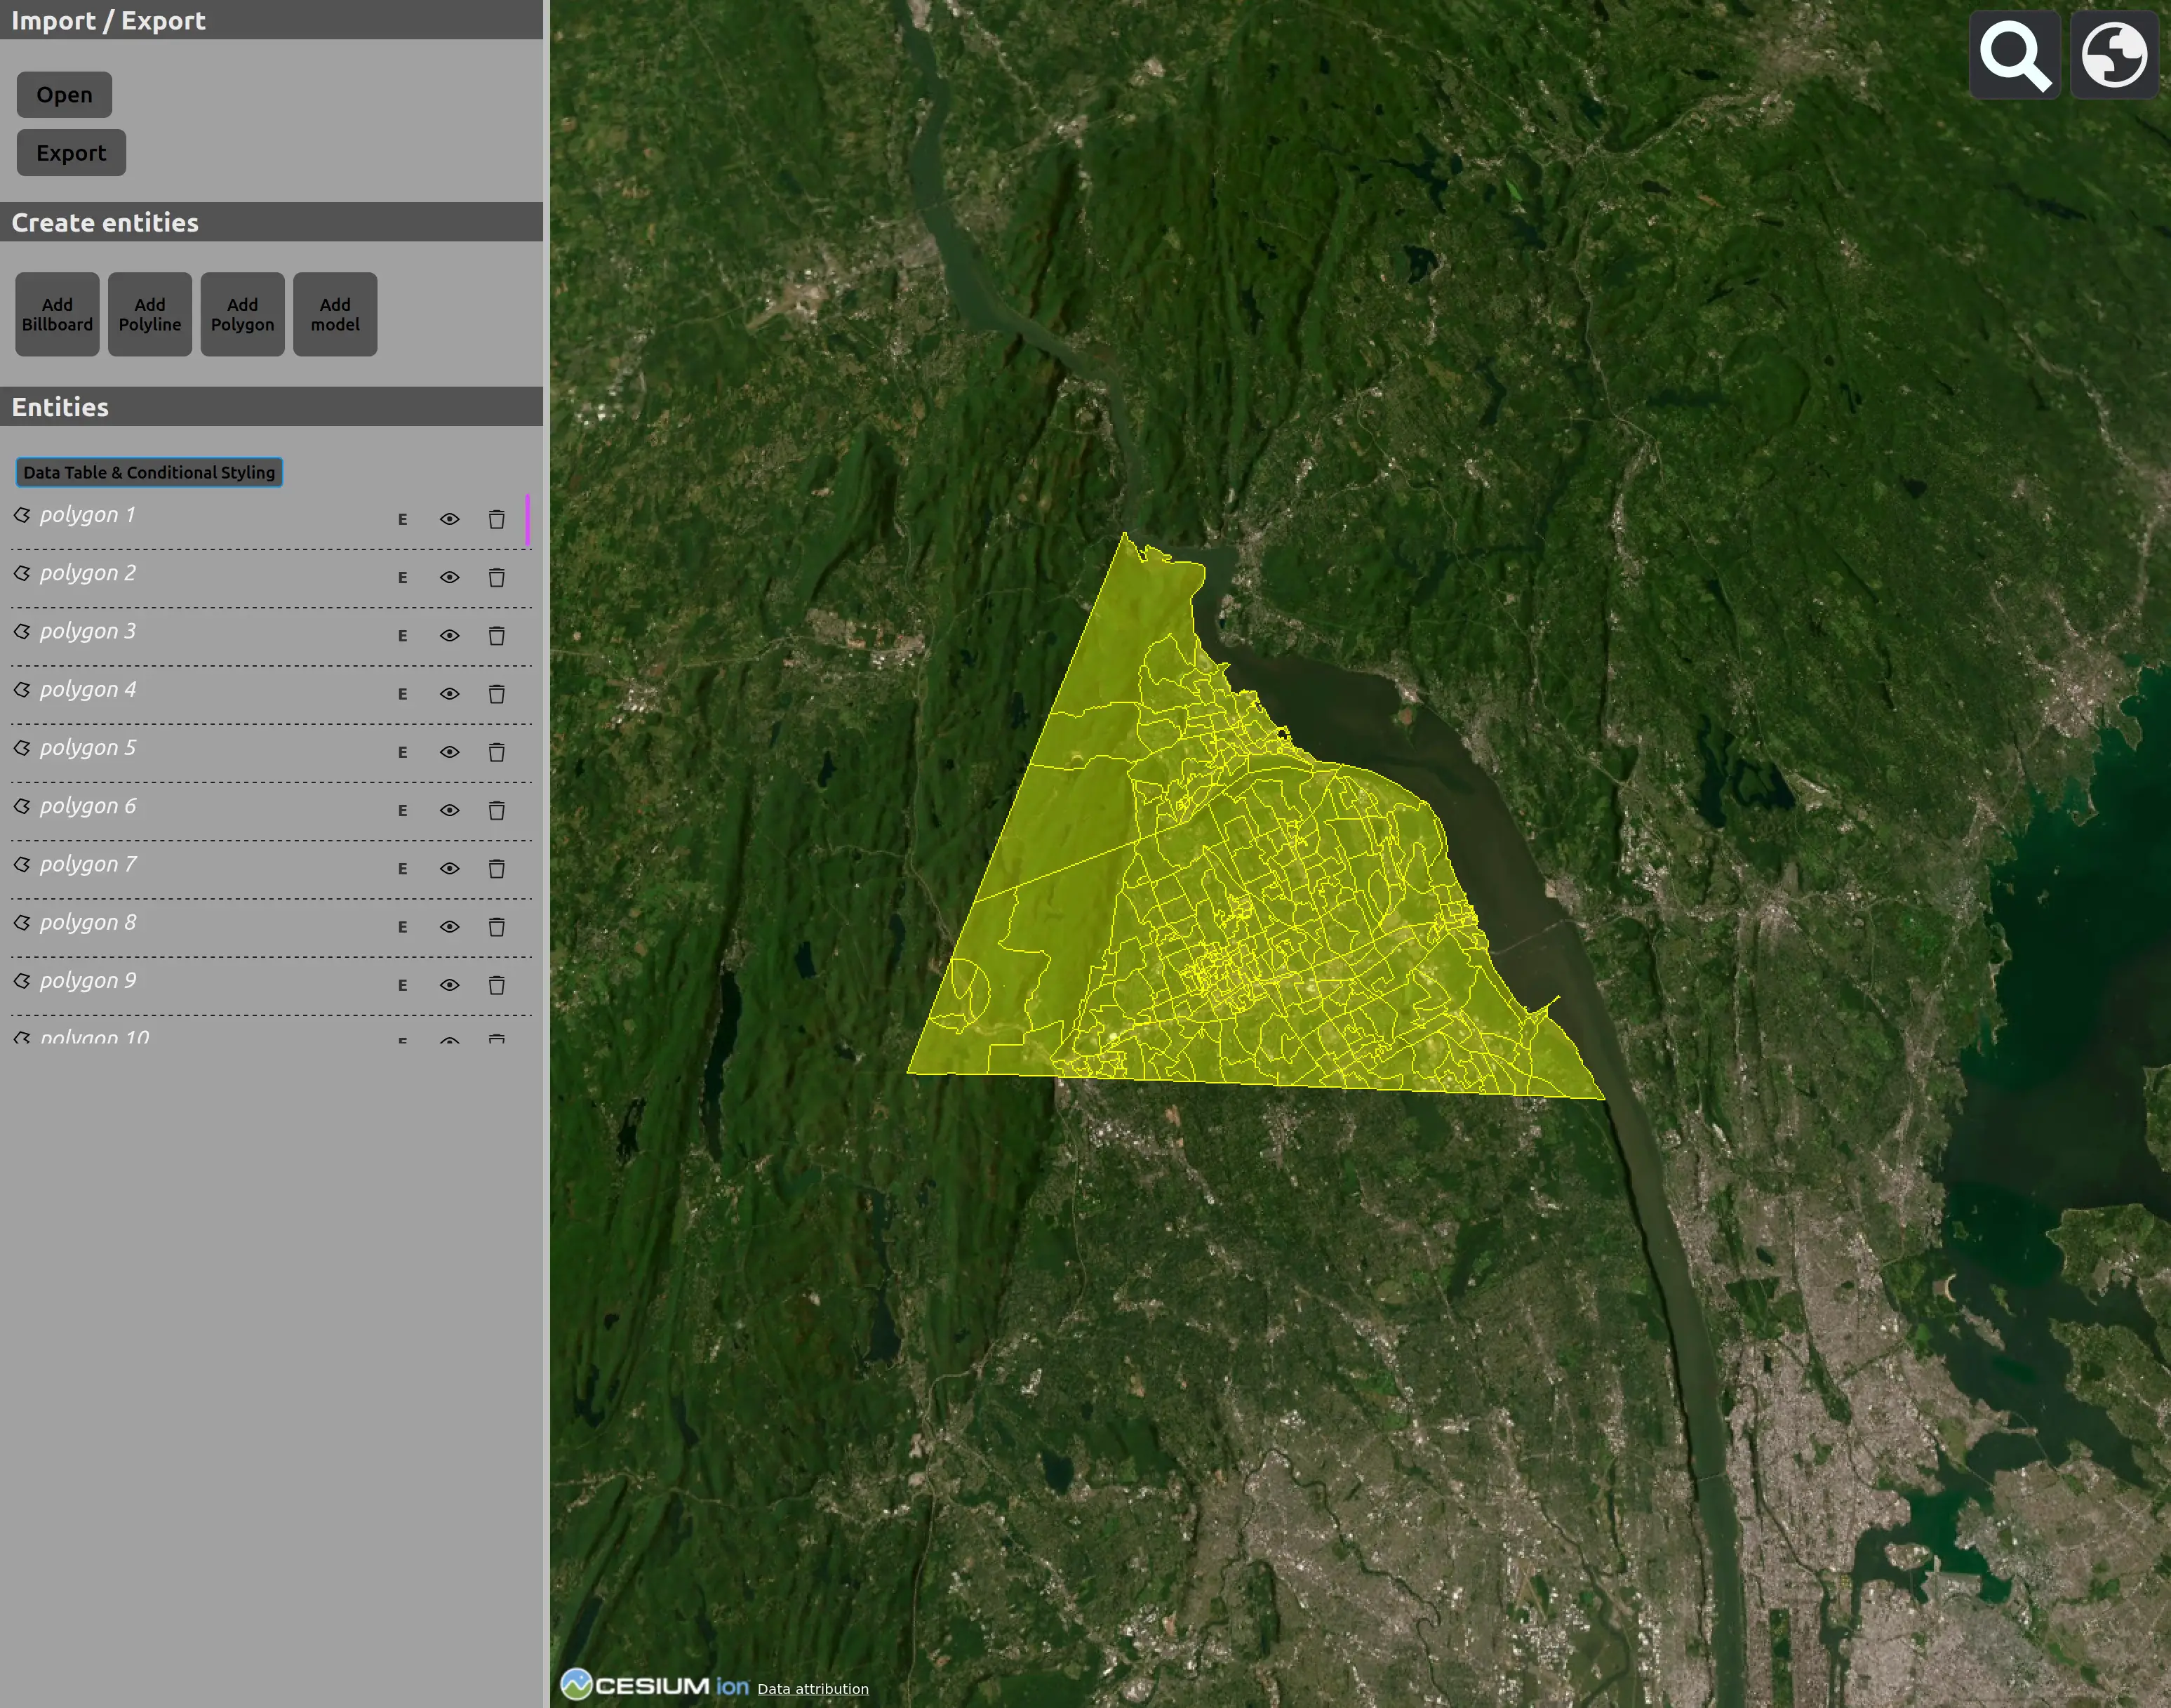
Let’s see how it looks on the map.
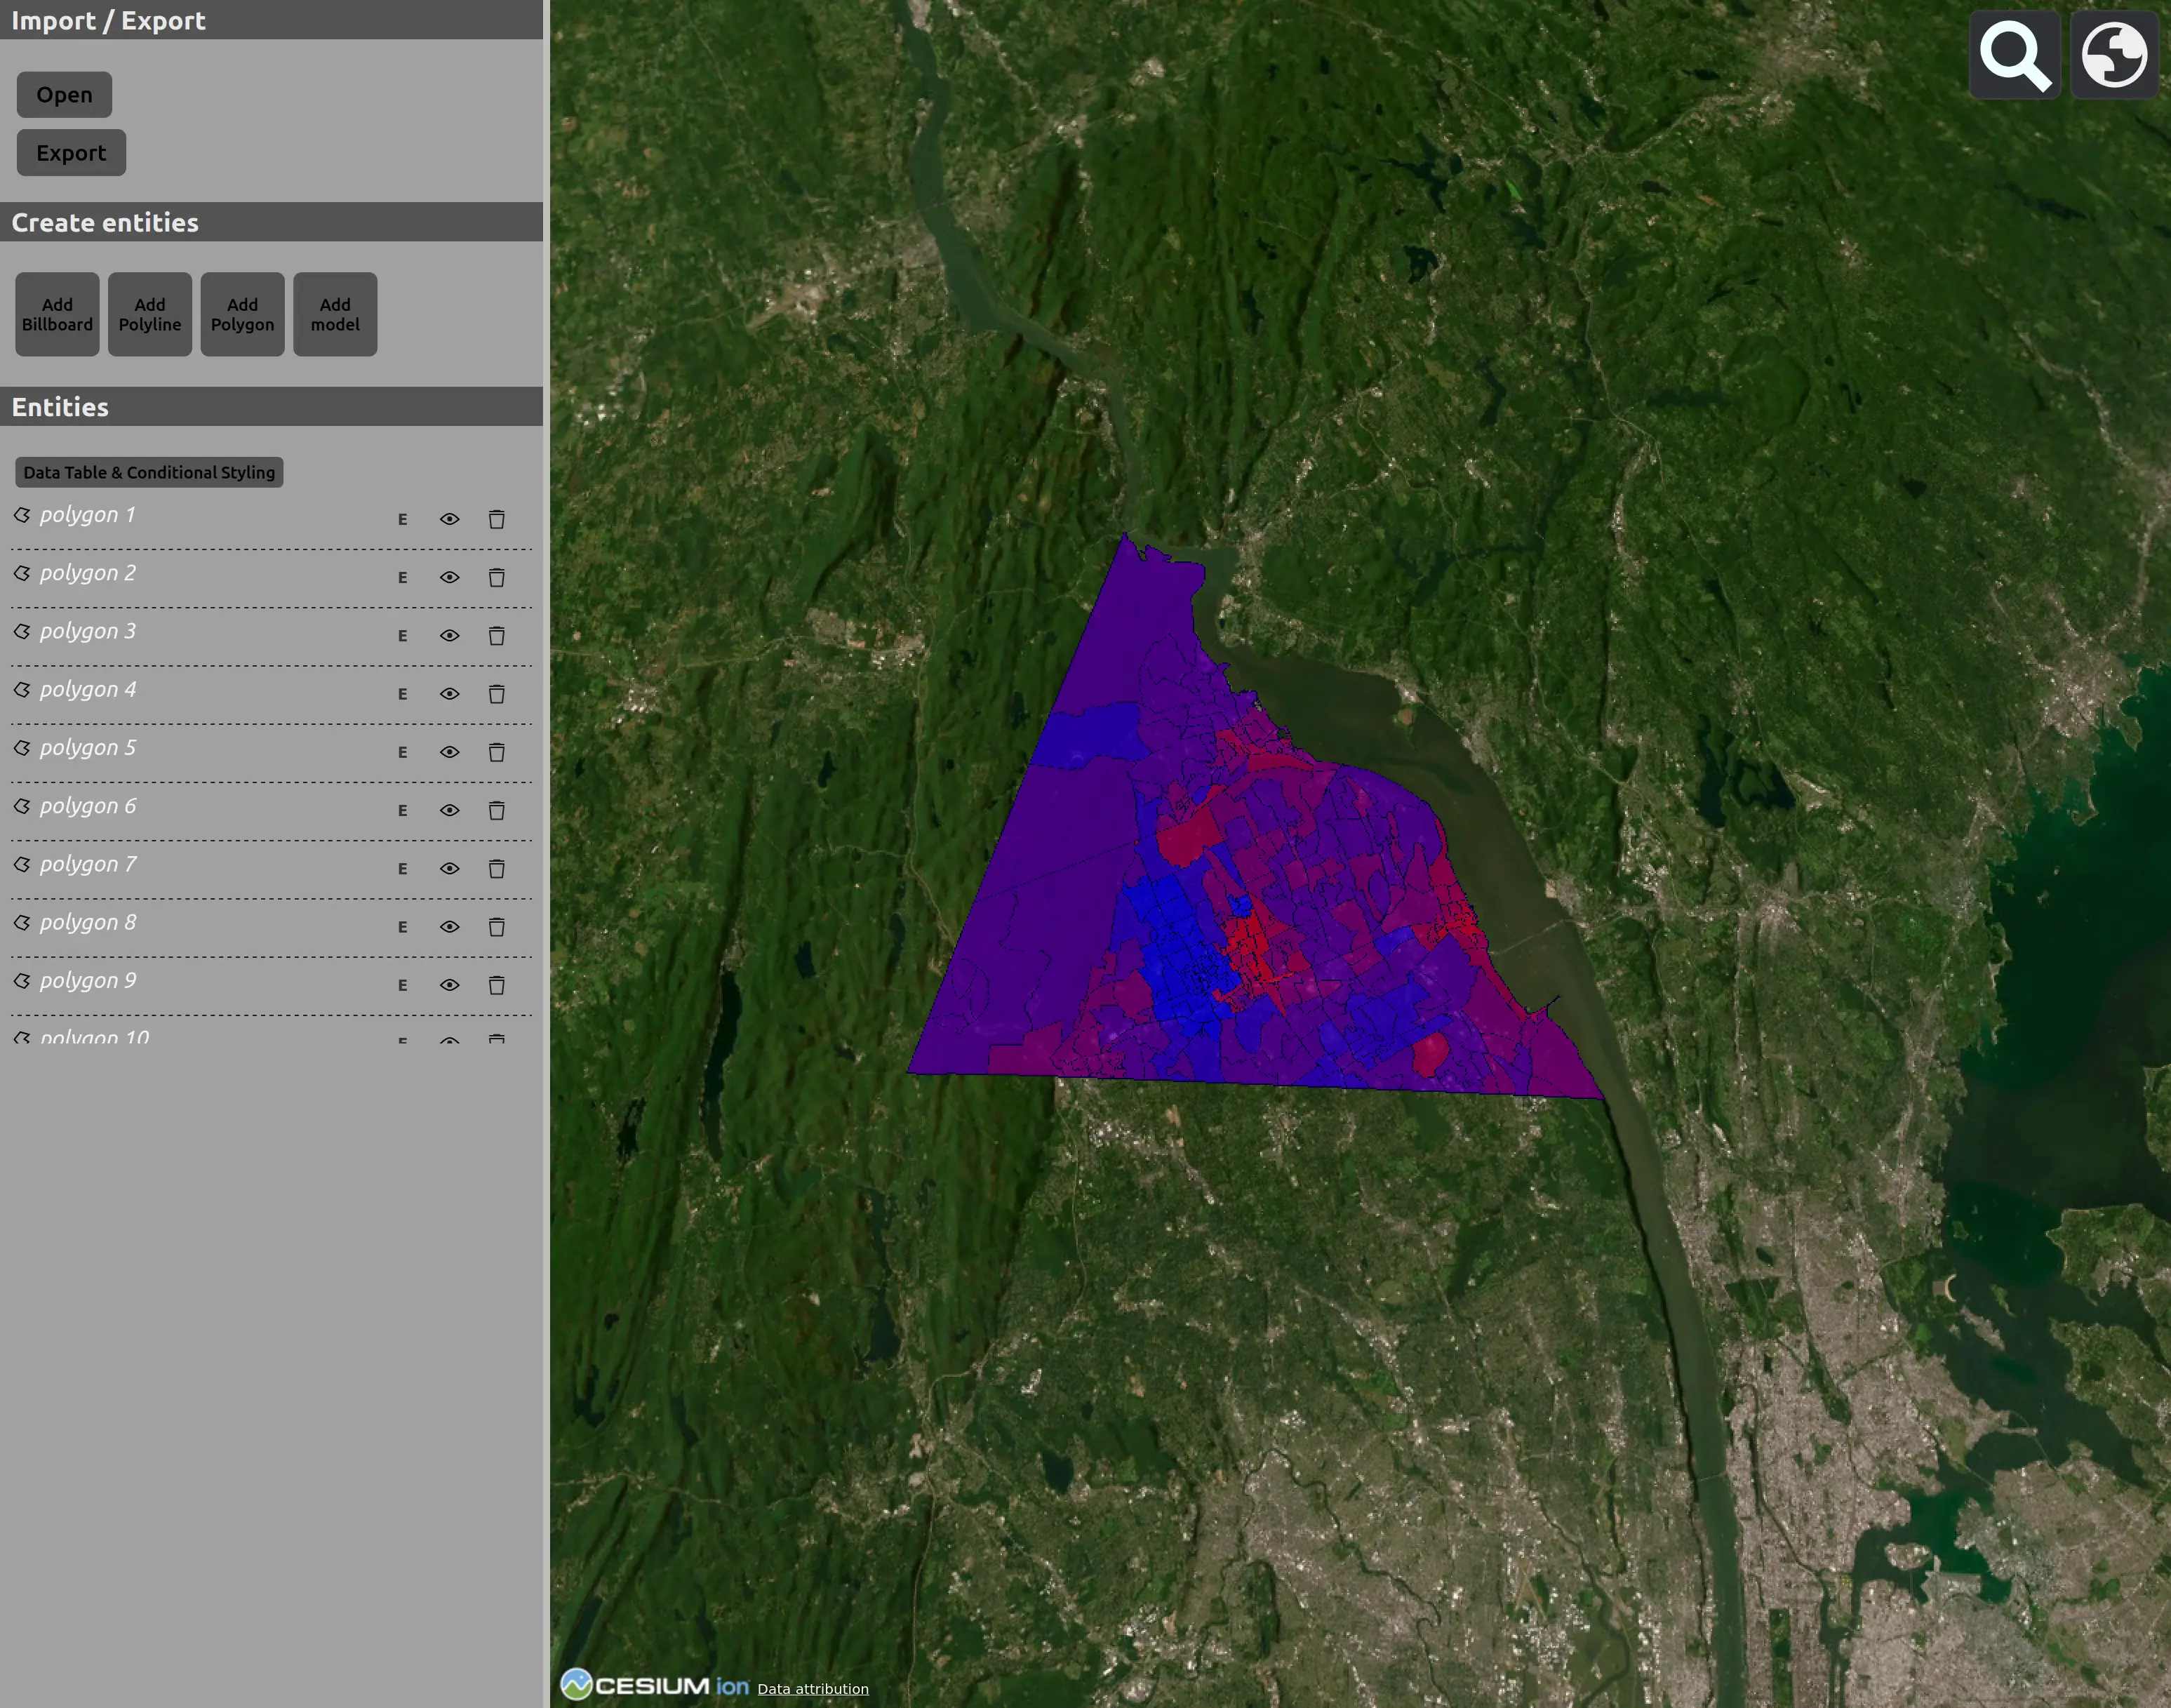
Very nice! Now let’s add some labels for a different attribute, the election district.
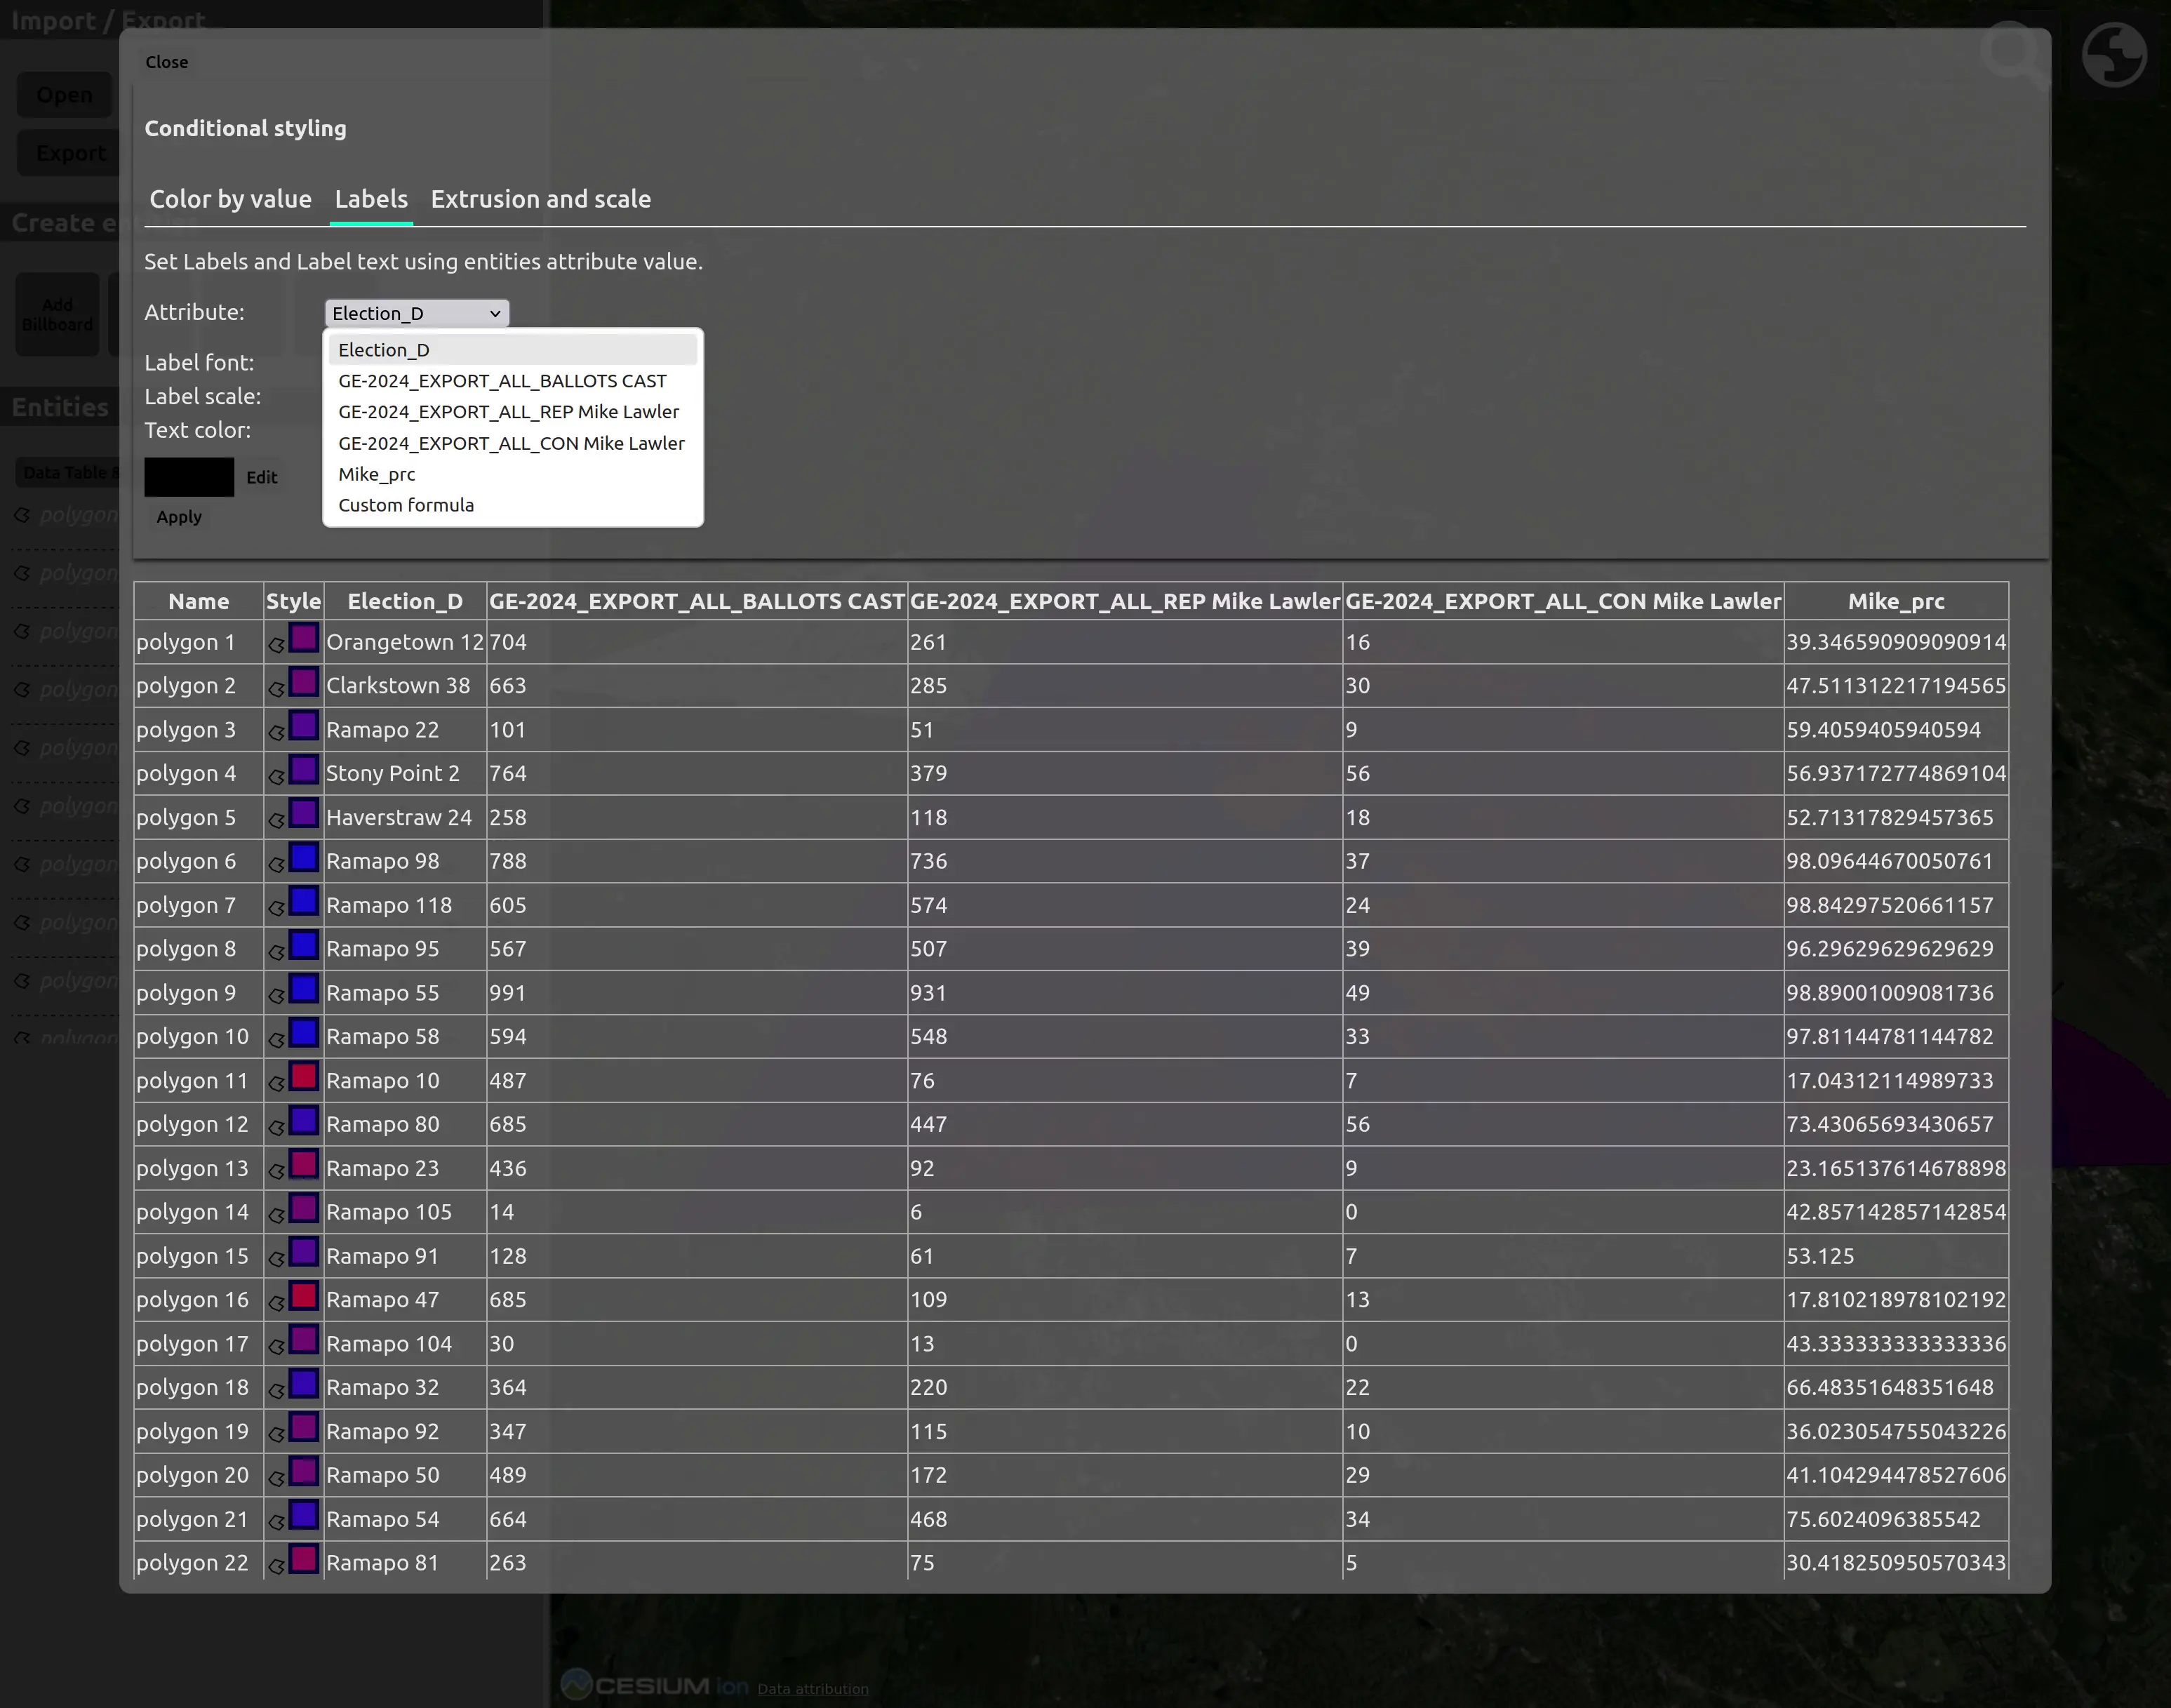
You can see the text color defaults to black, which won’t read well on our colored districts. Let’s change it by hitting the “edit” button next to the color.
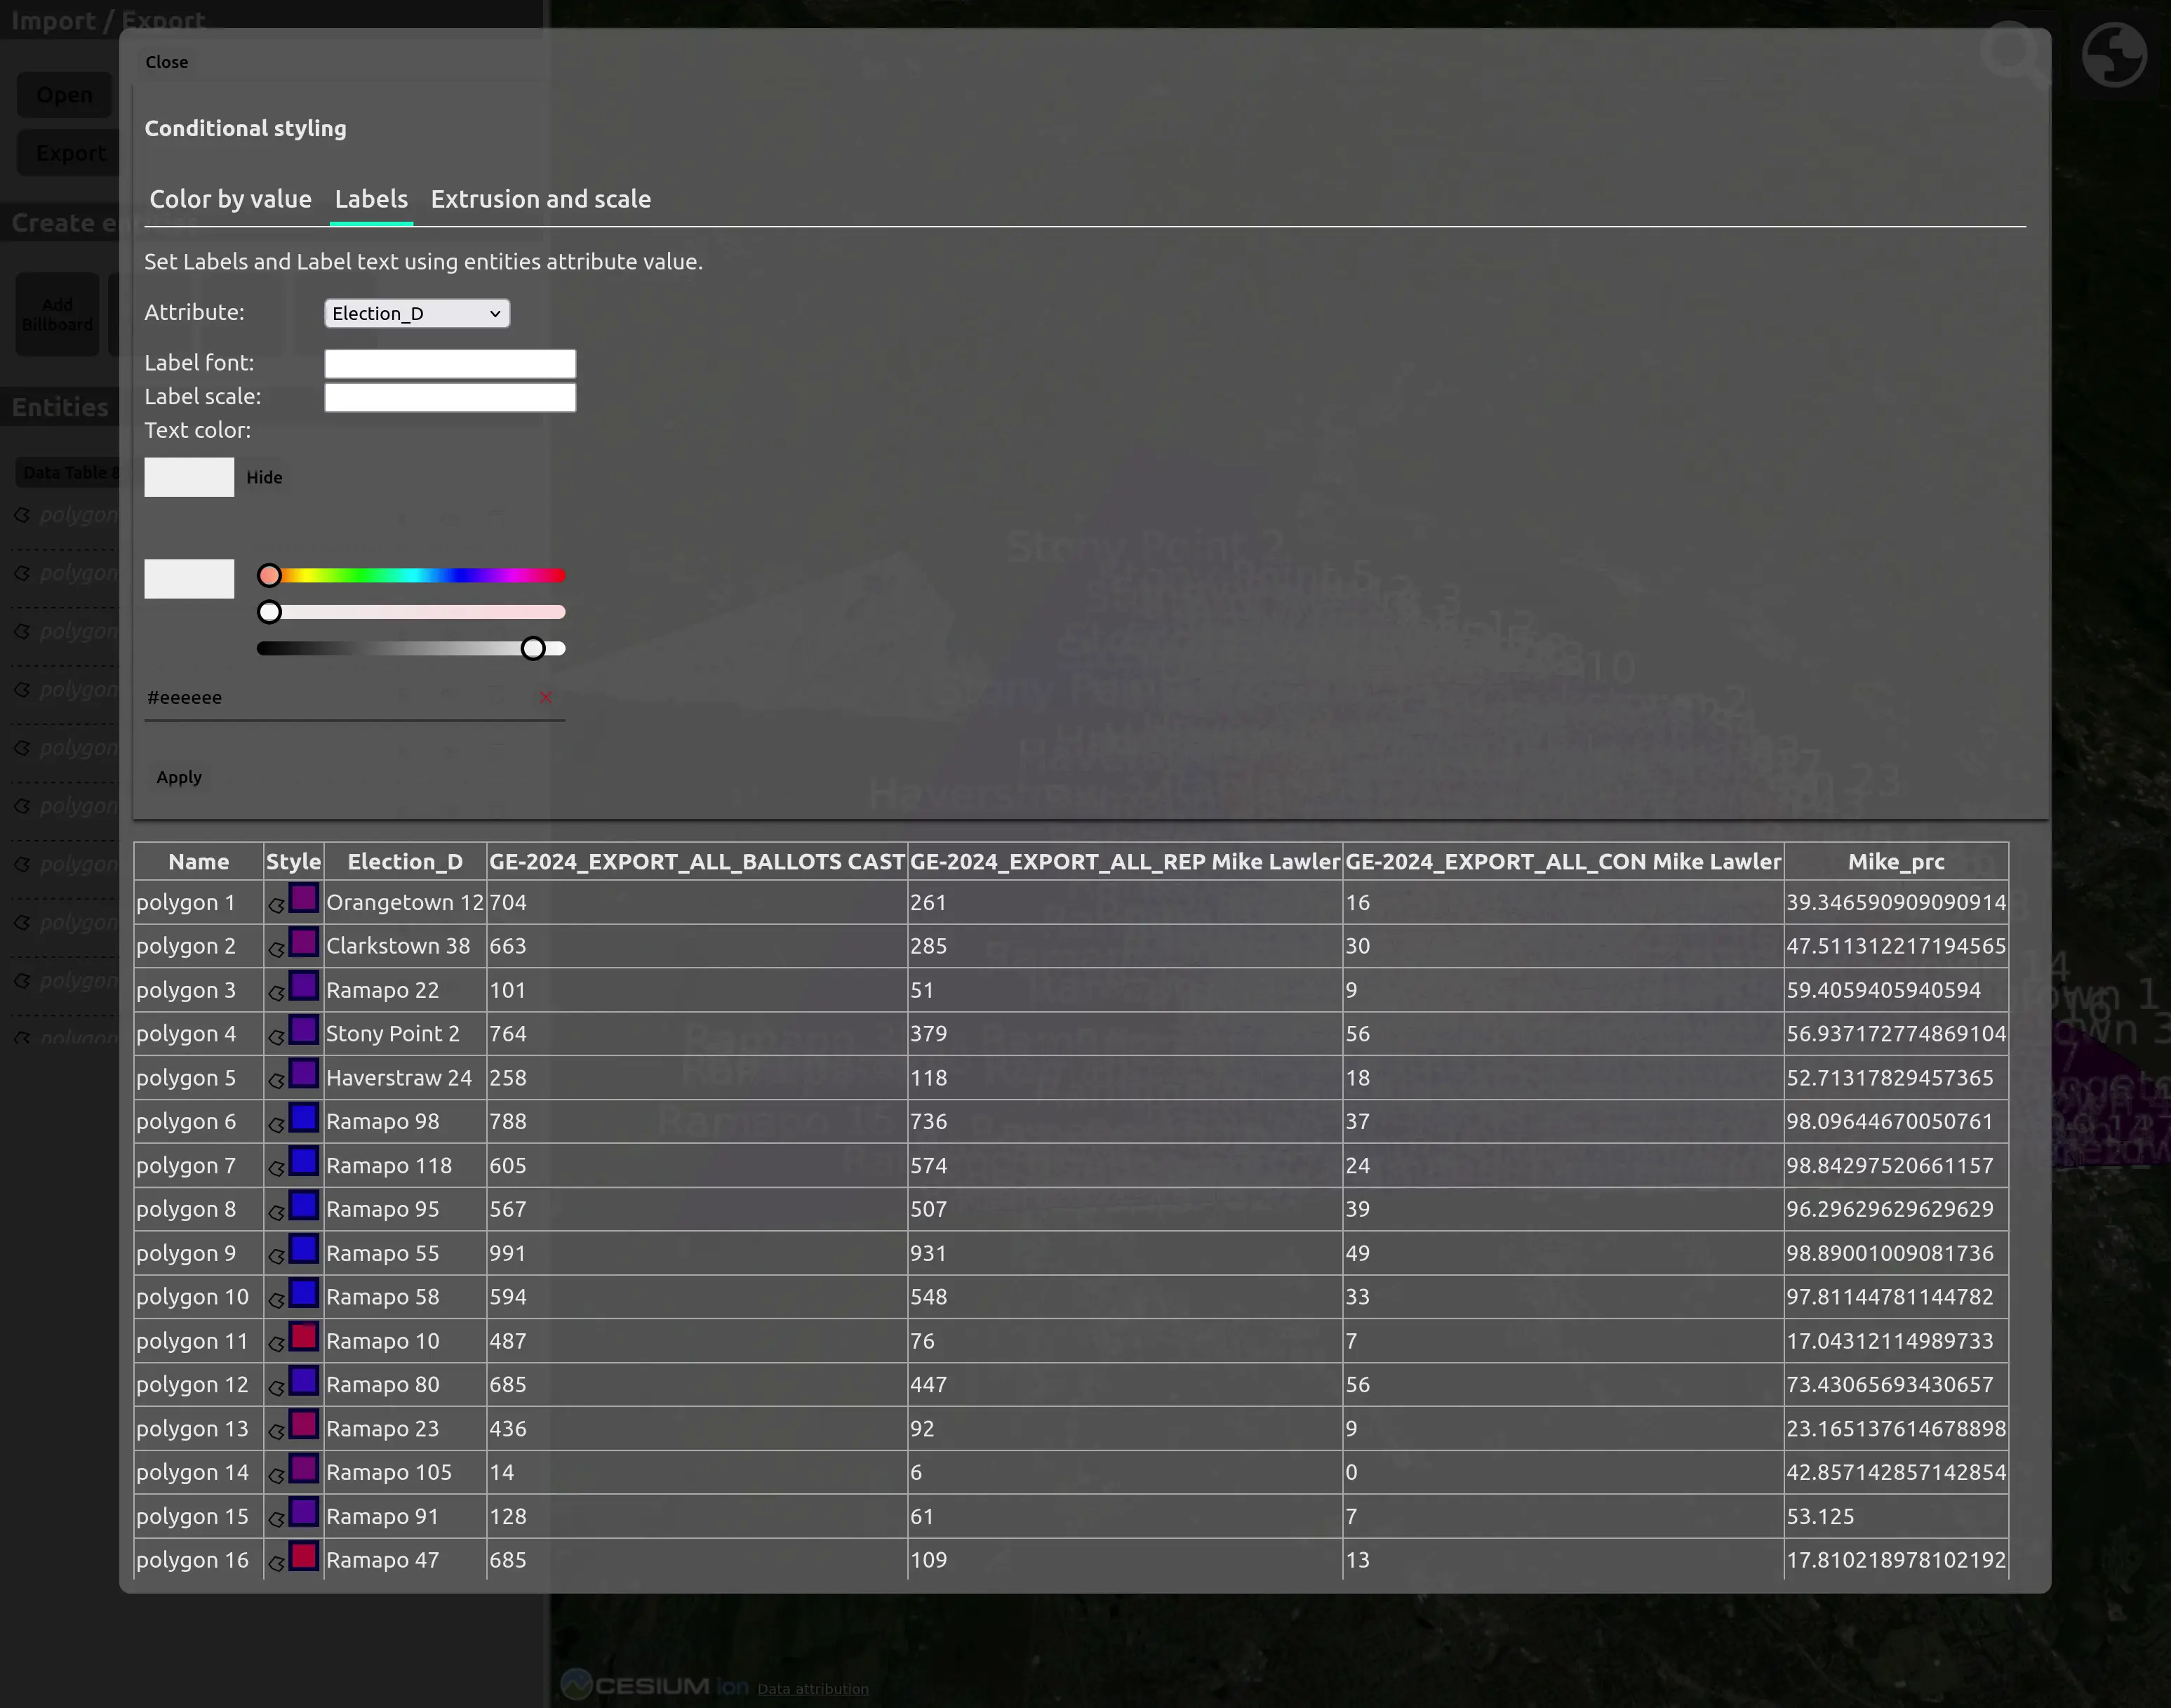
I changed it to a light gray. Let’s look at the map now.
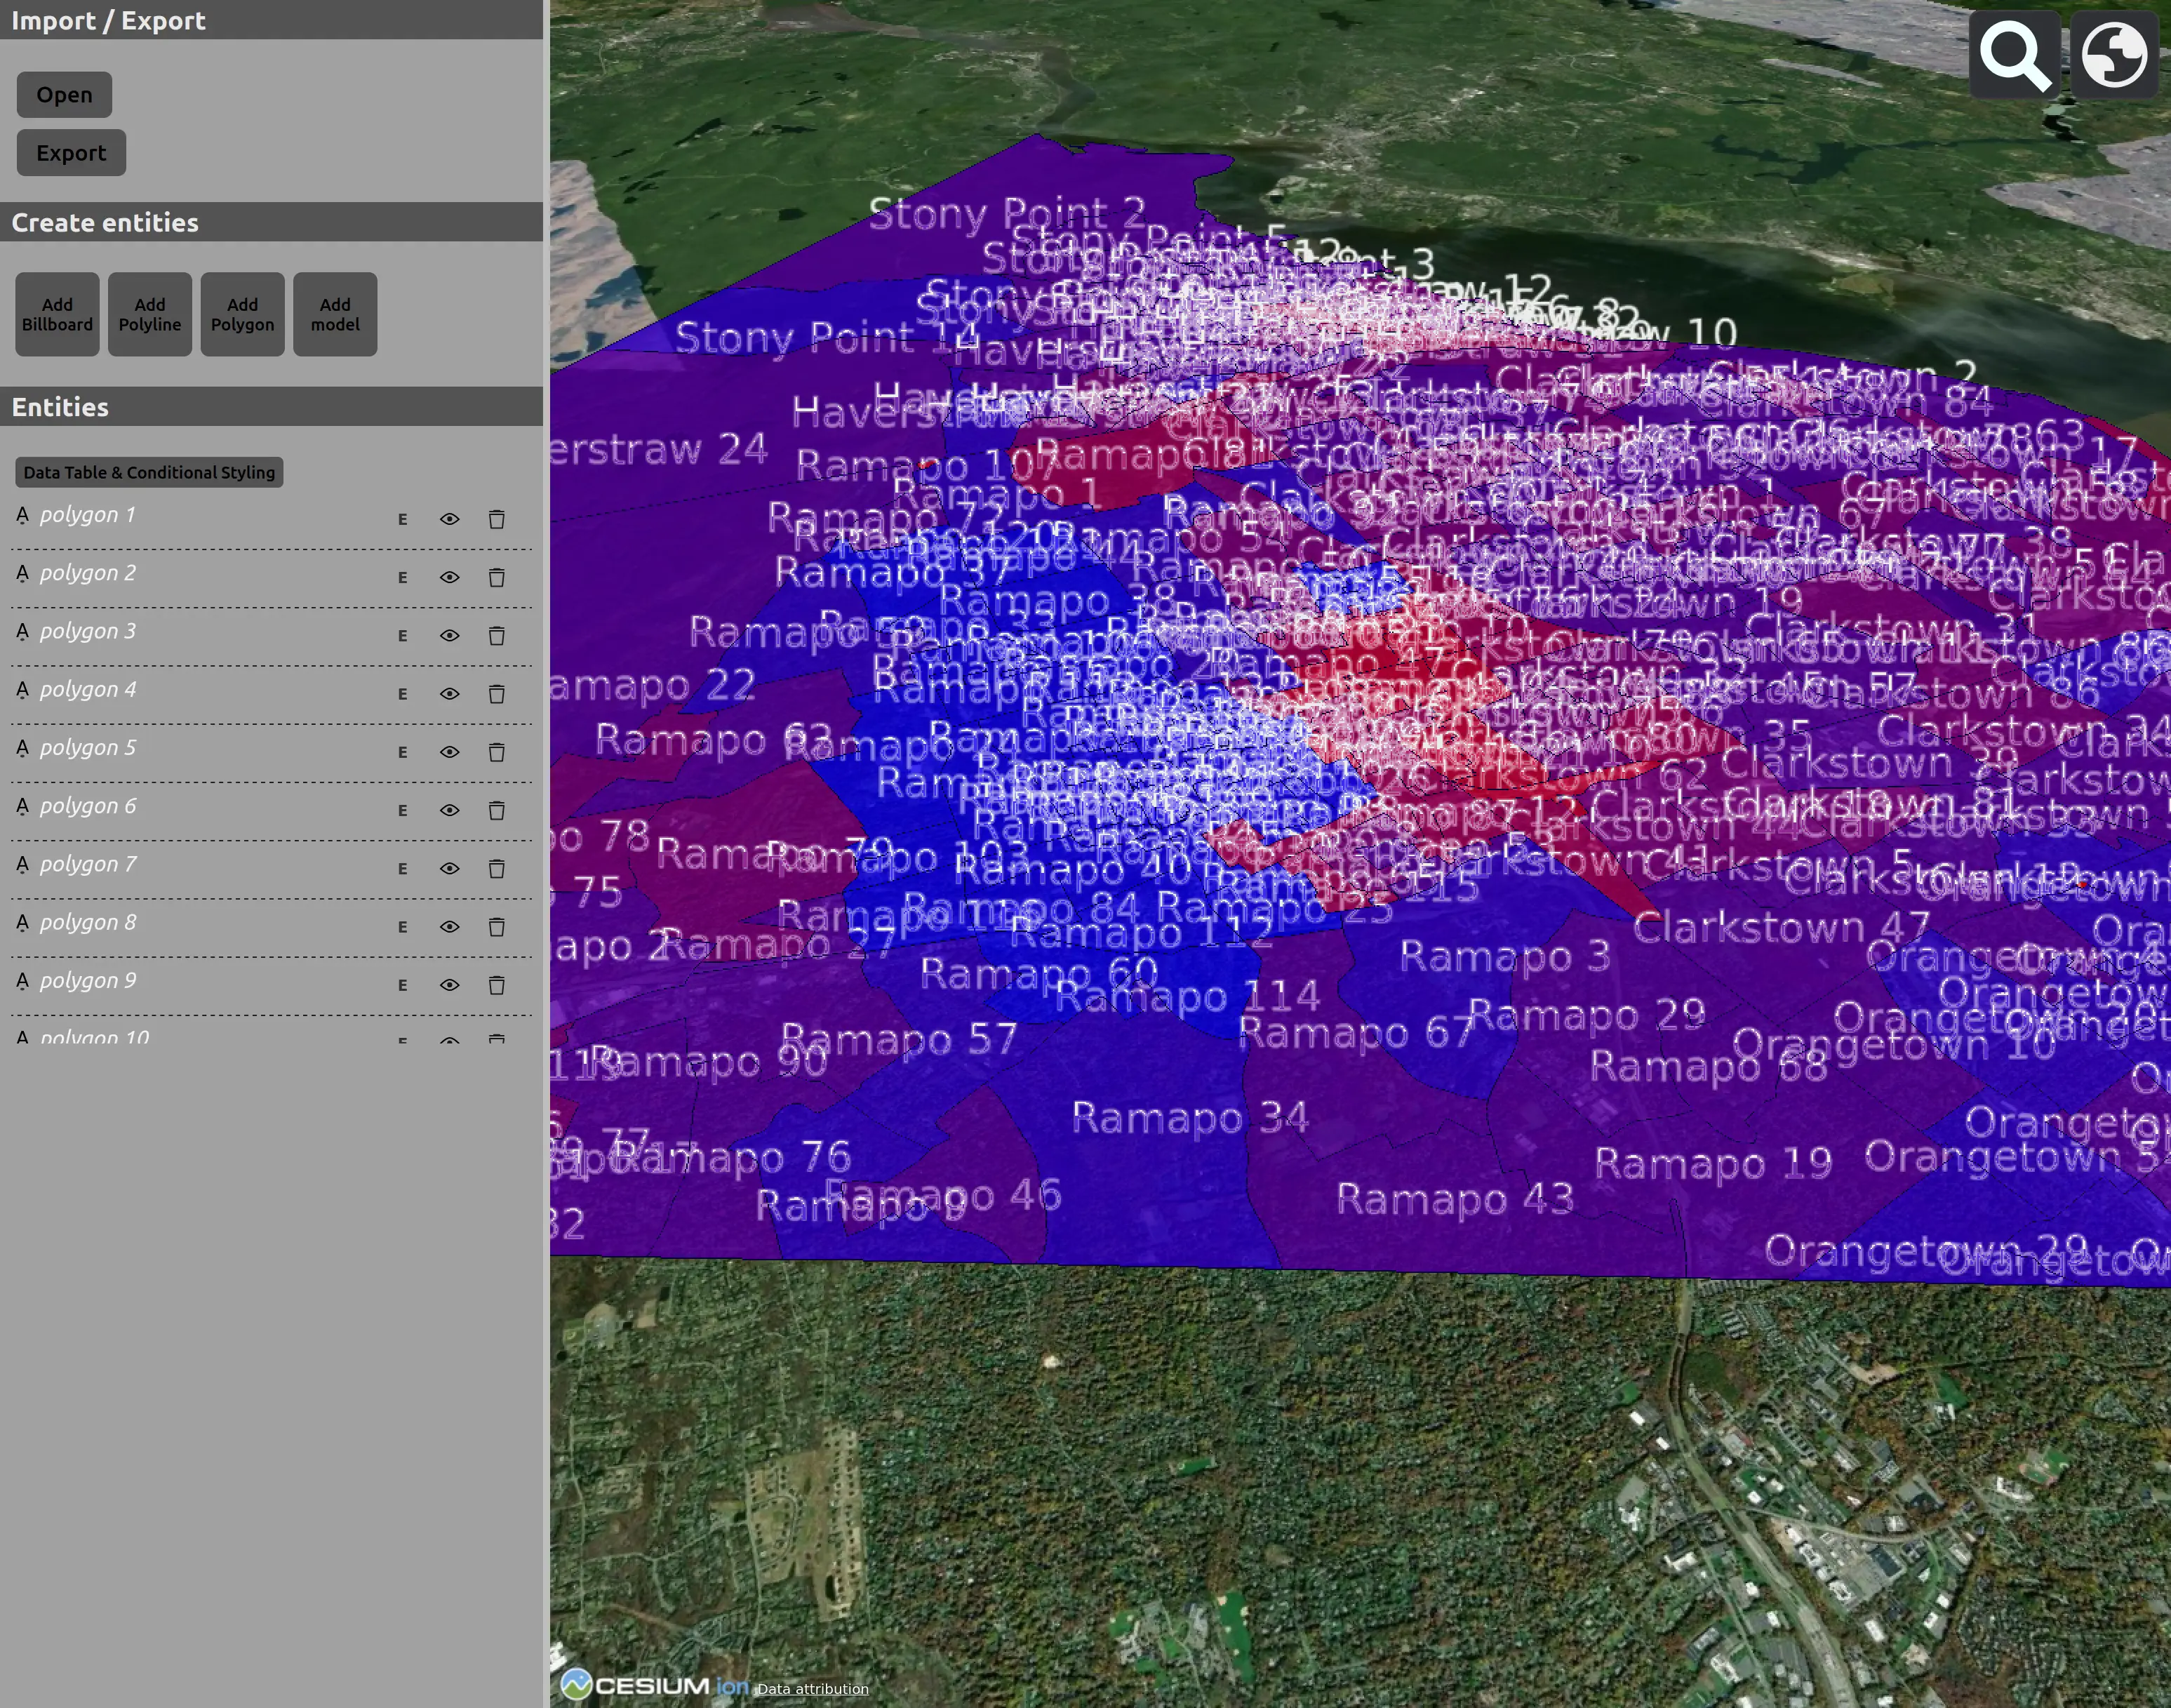
Lots of labels! This is quite a dense area, so you would probably want to zoom in further to see the labels more clearly.
See my previous blog post introducing the Cesium CZML-KML Editor for more about the Cesium CZML-KML editor.
cesium google-earth gis open-source visionport kml
Comments