Virtual Page Tracking and Goals with Google Analytics

By Steph Skardal
April 6, 2011
Sometimes I come across websites that don’t use RESTful URLs or have too unique (with an order number) URLs during checkout and I need to implement Goal Tracking in Google Analytics on these user interactions. I’ve also had to implement Goal Tracking in a non-ecommerce web application where tabbed on-page browsing guides users through a 3-step process. Examples of situations that pose challenges to traditional page tracking in Google Analytics include:
- Throughout Interchange’s checkout, URLs are posts to “/process”, which makes the user interactions difficult to distinguish.
- Throughout Spree’s checkout, URLs are posts to “/order/:id/edit”, which are distinct and can be difficult to aggregate.
- In a Sinatra application we developed recently, the single page URL is “/locate.html”, but tabbed browsing occurs through three unique steps.
Google Analytics Tagging
To add Goal Tracking by URL, pages must first be tagged as “virtual pages”. To implement virtual page tracking in Google, it’s as simple as including a new virtual page URL in the _trackPageview action:
<script type="text/javascript">

  var _gaq = _gaq || [];
  _gaq.push(['_setAccount', 'UA-XXXXXXXX-1']);
- _gaq.push(['_trackPageview']);
+ _gaq.push(['_trackPageview', '/cart/basket']);

  (function() {
    var ga = document.createElement('script'); ga.type = 'text/javascript'; ga.async = true;
    ga.src = ('https:' == document.location.protocol ? 'https://ssl' : 'http://www') + '.google-analytics.com/ga.js';
    var s = document.getElementsByTagName('script')[0]; s.parentNode.insertBefore(ga, s);
  })();

</script>
In the cases I described above, here are the tags used for each:
| Interchange | Spree | Sinatra App |
On a three page checkout process, the following virtual pages were tagged:
|
On a multi-page checkout process, the following virtual pages were tagged:
|
On a three page process, the following virtual pages were tagged:
|
Goal Definition
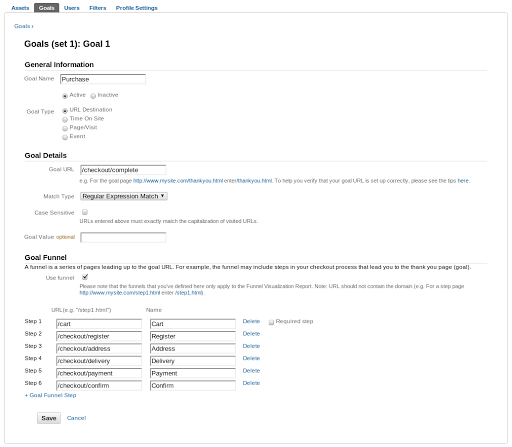
After tagging is complete, you’ll need to define a Goal in Google Analytics to begin tracking it.
|
First, you’ll want to name your goal. Here I’ve named the goal “Purchase”. In this case, the Goal is a URL Destination based on our new tags. The Goal URL is set to “/checkout/complete” for the Spree example described above. In this case, I have it set to a Regular Expression Match, but an Exact Match will work as well. I haven’t assigned a Goal Value and I’ve left the match case insensitive for now. Next, I add the steps involved leading up to the goal URL. This will allow you to visualize a goal funnel and see where users may be abandoning checkout. In this example, each of the steps of the funnel correspond to a checkout step (shopping basket, optional register page, individual checkout steps, receipt/complete page). Note that this screenshot was taken from the new Google Analytics interface. The old Google Analytics interface may appear slightly different, but contains similar content. |
Looking at the Data
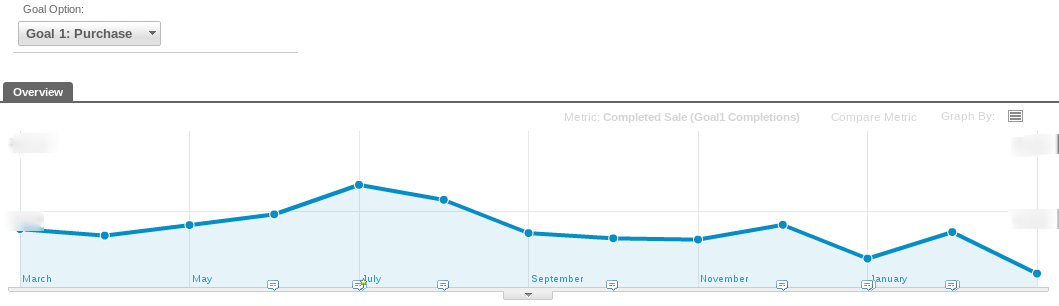
With virtual page tracking and goal tracking, you can see how many goals have been completed during a certain time frame:
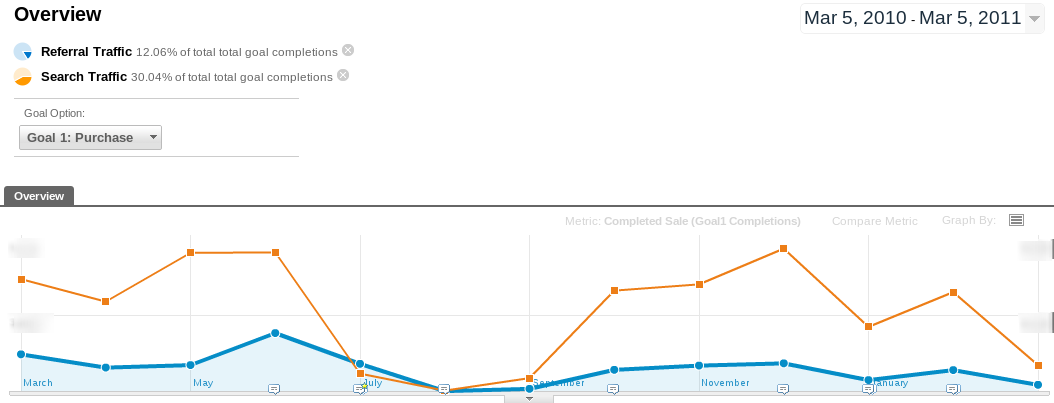
You can also compare regular segments of traffic: e.g. users that found your site through search versus referrals:
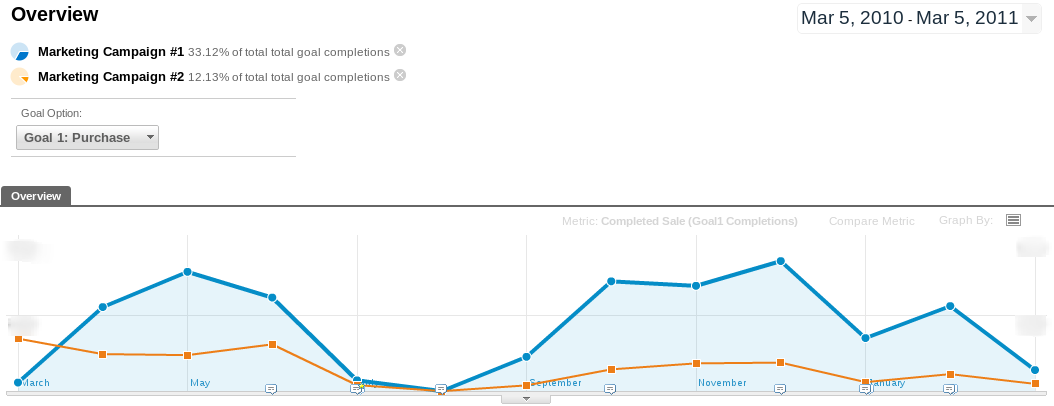
You can compare advanced segments of visitors: e.g. marketing campaign #1 versus marketing campaign #2. This type of comparison may give you more actionable metrics to determine which marketing campaign to put more resources into.
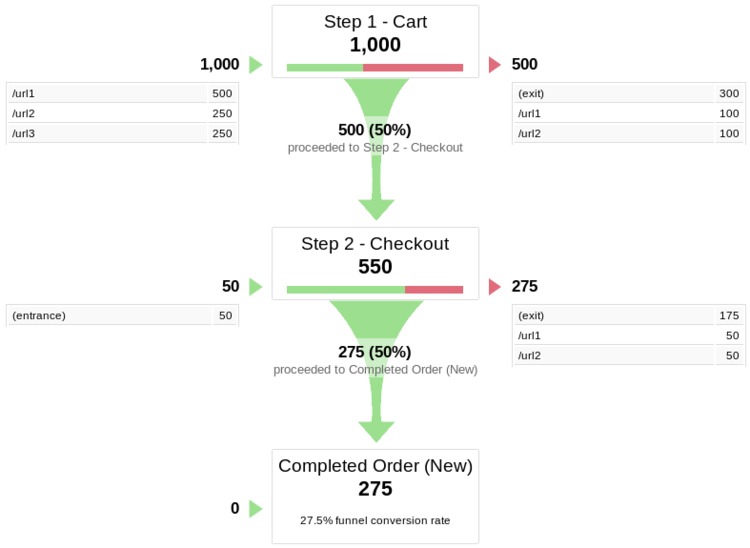
Last but not least, you can visualize the funnel of conversion to see where you might be losing customers. This might also be actionable in that you may be able to A/B test checkout process (or another type of conversion) changes to improve conversion.
analytics ecommerce javascript
Comments