(Image|Graphics)Magick trick for monitoring or visualizations

By Kiel Christofferson
November 3, 2010
It’s a good time for all when we start poking fun at the visual assault of stereotypical PowerPoint presentations. On the other hand, when data is presented in an effective visual format, human brains are able to quickly grasp the ideas involved and pick out important pieces of information, such as “outliers”.
Without getting into a long trumpeting session about the usefulness of data visualization (there are plenty of books on the subject), I’d like to jump directly into a Magick trick or two for creating simple visualizations.
Let’s imagine we’ve got a group of machines serving a particular purpose. Now let’s say I want quick insight into not only the internal activity of all 8 machines, but also what the systems believe they are sending to their displays.
With a little magick (of the ImageMagick or GraphicsMagick variety), we can save ourselves from running “ps” and “free” and from having to be in the same room (or the same country) as the system we’re checking up on.
First, let’s organize some simple output from the system:
$ echo -en "$(hostname) GPID: $( pgrep googleearth-bin ). APPID: $( pgrep -u root -f sbin/apache2 ).\nCRASH: $( ls -1 ${HOME}/.googleearth/crashlogs/ | wc -l ). MEMF: $( awk '/^MemFree/ {print $2$3}' /proc/meminfo )."Which gives us output something like this:
lg1 - GPID: 5265. APPID: 10452.
CRASH: 3. MEMF: 4646240kB.
Cool, but we want to combine this with the imagery supposedly being currently displayed by X. So, we turn it into an image that we can overlay, like this:
$ echo -en "$(hostname) GPID: $( pgrep googleearth-bin ). APPID: $( pgrep -u root -f sbin/apache2 ).\nCRASH: $( ls -1 ${HOME}/.googleearth/crashlogs/ | wc -l ). MEMF: $( awk '/^MemFree/ {print $2$3}' /proc/meminfo )." | \
convert -pointsize 18 -background '#00000080' -fill white text:- -trim -bordercolor '#00000080' -border 5x5 miff:/tmp/text
This is one long command and might be hard to read, but it is simply using “convert” to turn the text output into a semi-transparent “miff” image for later use. It would be very easy to put the stat collection into a script on each host, but we’re just going with quick and dirty at the moment.
Second, let’s get our little overlay image composited with a screenshot from X:
$ DISPLAY=:0 import -window root miff:- | composite -gravity south -geometry +0+3 miff:/tmp/text miff:- -resize 600 miff:/tmp/$(hostname).miffSo, in a single pipeline we imported a screenshot of the root window, then used “composite” to overlay our semi-transparent stats image and resize the whole thing to be a bit more manageable.
Finally, we want to perform these things across all the systems and be left with something we can quickly glance at to see if there are obvious problems. So, let’s create a quick shell loop and execute our commands via ssh, placing the resize/composite burden on the shoulders of each individual system (be sure to escape variables for remote interpolation!):
#!/bin/bash

#collect data first
for system in `seq 1 8`; do
 ssh user@$system "

echo -en \"\$(hostname) GPID: \$( pgrep googleearth-bin ). APPID: \$( pgrep -u root -f sbin/apache2 ).\nCRASH: \$( ls -1 \${HOME}/.googleearth/crashlogs/ | wc -l ). MEMF: \$( awk '/^MemFree/ {print \$2\$3}' /proc/meminfo )." | \
convert -pointsize 18 -background '#00000080' -fill white text:- -trim -bordercolor '#00000080' -border 5x5 miff:/tmp/text;

DISPLAY=:0 import -window root miff:- | \
composite -gravity south -geometry +0+3 miff:/tmp/text miff:- -resize 600 miff:-" >/tmp/system${system}.miff;

done

#make a montage of the data
montage -monitor -background black -tile 8x1 -geometry +5+0 \
 /tmp/system{6,7,8,1,2,3,4,5}.miff \
 /tmp/system-montage.png && rm -f /tmp/system?.miff
With something so simple, we can quickly view from New York what’s happening on systems installed in California, like so:
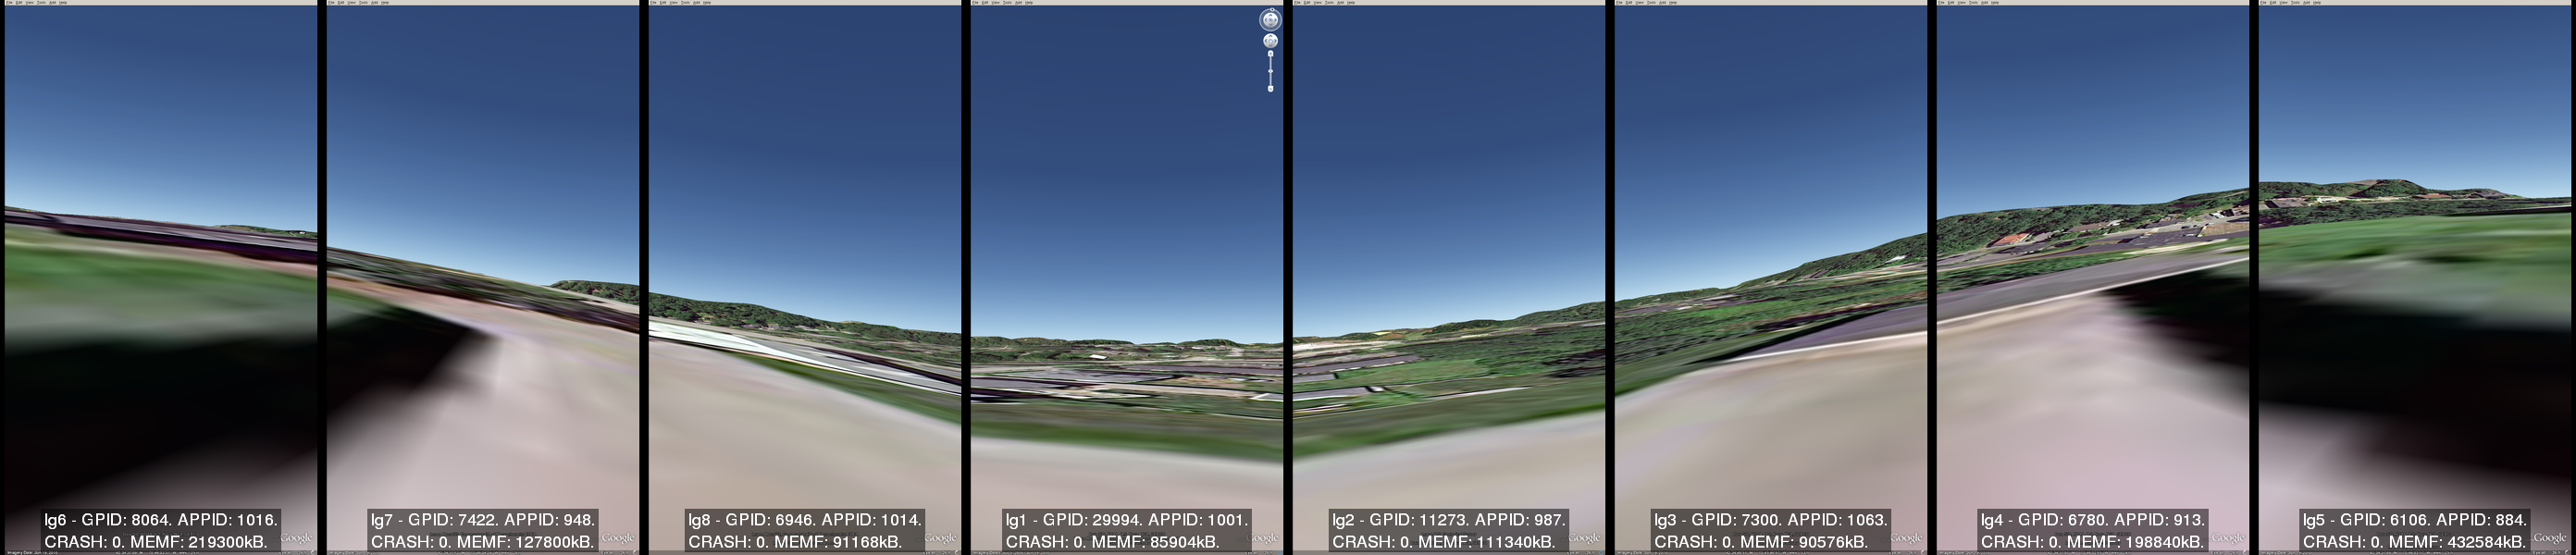
graphics linux visionport monitoring
Comments