Announcing Release of PostgreSQL System Impact (PGSI) Log Analyzer
The PostgreSQL System Impact (PGSI) log analyzer is now available at https://bucardo.org/Pgsi/.
System Impact (SI) is a measure of the overall load a given query imposes on a server. It is expressed as a percentage of a query’s average duration over the its average interval between successive calls.
Queries are collected into canonical form with respect to literals and bind params; further, IN lists of varying cardinality are collapsed. Thus, queries that differ only in argument composition will be collected together in the evaluation. However, logically equivalent queries that differ in any other manner of structure (say two comparisons between and that are transposed) will be seen as distinct.
The goal of SI is to identify those queries most likely to cause performance degradation on the database during heaviest traffic periods. Focusing exclusively on the least efficient queries can hide relatively fast-running queries that saturate the system more because they are called far more frequently. By contrast, focusing only on the most-frequently called queries will tend to emphasize small, highly optimized queries at the expense of slightly less popular queries that spend much more of their time between successive calls in an active state. These are often smaller queries that have failed to be optimized and punish a system severely under heavy load.
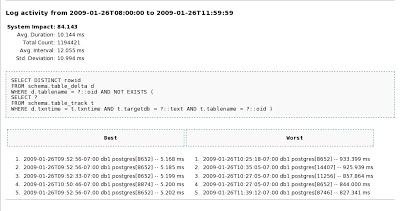
PGSI requires full PostgreSQL logging through syslog with a prescribed format. Specifically, log_statement must be ‘all’ and log_duration must be ‘on’. Given a continuous log interval of any duration, PGSI will calculate reports in wiki-ready format with the following data over that interval:
- First line defines suggested wiki page name for the given report
- Log interval over which the report applies
- SI, sorted from worst to best
- Average duration of execution for the canonical query
- Total count of times canonical query was executed
- Average interval between successive executions
- Standard deviation of the duration
- Display of the canonical query
- List of log entries for best- and worst-duration instances of the canonical query (only if report was generated using the –offenders option).
PGSI can be downloaded in tar.gz format or can be accessed from Git, its version-control system at the bucardo/pgsi repository.
Contributions are welcome!


Comments