Vue.js Remote Devtools Review

By Patrick Lewis
June 1, 2019
 Photo by Marco Verch, used under CC BY 2.0
Most Vue.js developers will be familiar with Vue.js devtools in the form of Chrome or Firefox browser extensions/addons. The Vue.js devtools integrate nicely into Chrome and Firefox’s native developer tools in the form of a new ‘Vue’ tab that provides a developer with the ability to browse their component hierarchy, investigate the state of their application’s Vuex store, and several other useful features.
I was a longtime Safari user who eventually became disappointed with its limited extension support (as compared to Chrome or Firefox-based browsers); there was once a Safari version of Vue.js devtools that required some manual installation, but development on that version ended back in early 2018.
An alternative for Safari users, or developers who want to debug Vue.js applications running on other clients such as mobile devices, is the standalone vue-remote-devtools app. vue-remote-devtools is an Electron app that runs in its own window and is loaded in a Vue.js application via a remote connection. I was curious to see how the developer experience of using vue-remote-devools compared to the Chrome browser extension that I was familiar with.
Installation of vue-remote-devtools was simple, with just a single yarn global add @vue/devtools command. Once installed, I was able to run the app with a vue-devtools command which opened a new window on my desktop:
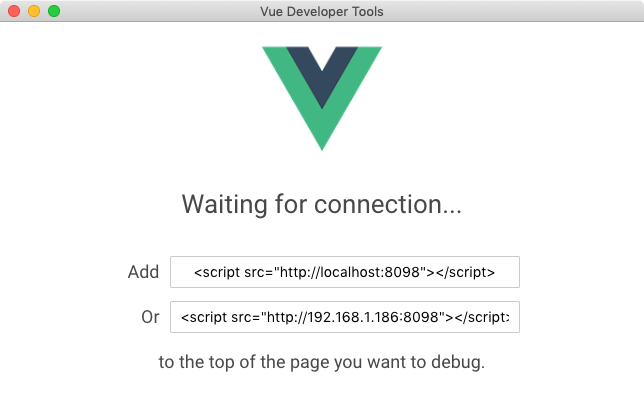
Then it was a matter of updating my Vue.js application to connect to Vue.js remote devtools running locally on my laptop. I added the <script src="http://localhost:8098"></script> tag to my application’s index page as described in the vue-remote-devtools documentation. When I loaded my Vue.js application in Safari I was confronted with a new problem: a Content-Security-Policy error preventing the browser from connecting to local port 8098:
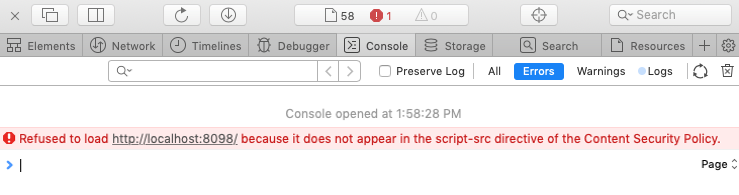
My Vue.js application is served from a Rails application via webpacker and already had a CSP in place, so it was relatively easy to update that with the needed configuration:
# config/initializers/content_security_policy.rb
Rails.application.config.content_security_policy do |policy|
policy.script_src :self, :https, :unsafe_eval, :unsafe_inline, 'http://localhost:8098'
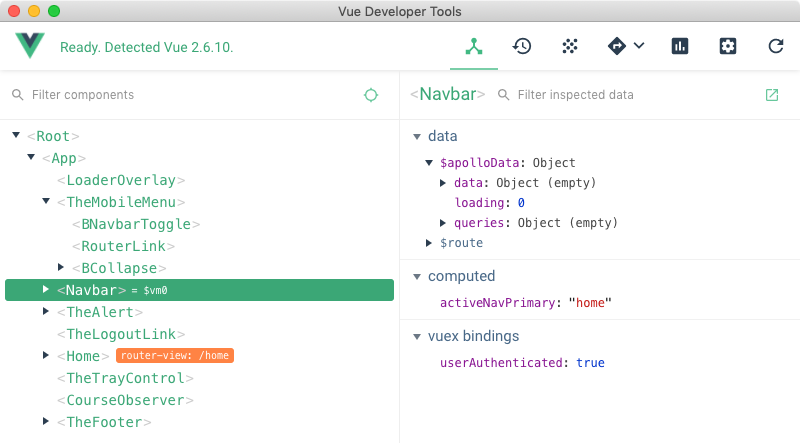
endAfter restarting Rails to load the updated CSP initializer, my Vue.js application successfully connected to Vue.js remote devtools and I saw an interface that was almost identical to what I was used to from the Chrome Vue.js devtools extension:
I’m glad that vue-remote-devtools exists and provides feature parity with the browser-based devtools, especially for debugging Vue.js applications running on mobile devices where there are no alternatives, but I will be sticking with the Chrome extension for my everyday use. I didn’t like the additional configuration needed to add a separate script tag and make a change to the CSP just to get the remote devtools connection established; in a multi-developer project, the script tag would introduce “Failed to load resource” browser console errors for any other developers who didn’t happen to be running remote devtools on their machines. I also found myself missing the way that the Chrome/Firefox extensions integrate nicely alongside those browsers’ existing developer tools, making it easy to switch between the Vue.js devtools and the JavaScript console or Elements view.
Comments