How to Add Labels to a Dimple JS Line Chart

By Matt Galvin
May 17, 2016
I was recently working on a project that was using DimpleJS, which the docs describe as “An object-oriented API for business analytics powered by d3”. I was using it to create a variety of graphs, some of which were line graphs. The client had requested that the line graph display the y-value of the line on the graph. This is easily accomplished with bar graphs in Dimple, however, not so easily done with line graphs.
I had spent some time Googling to find what others had done to add this functionality but could not find it anywhere. So, I read the documentation where they add labels to a bar graph, and “tweaked” it like so:
var s = myChart.addSeries(null, dimple.plot.line);
.
.
.
/*Add prices to line chart*/
s.afterDraw = function (shape, data) {
// Get the shape as a d3 selection
var s = d3.select(shape);
var i = 0;
_.forEach(data.points, function(point) {
var rect = {
x: parseFloat(point.x),
y: parseFloat(point.y)
};
// Add a text label for the value
if(data.markerData[i] != undefined) {
svg.append("text")
.attr("x", rect.x)
.attr("y", rect.y - 10)
// Centre align
.style("text-anchor", "middle")
.style("font-size", "10px")
.style("font-family", "sans-serif")
// Format the number
.text(data.markerData[i].y);
}
i++
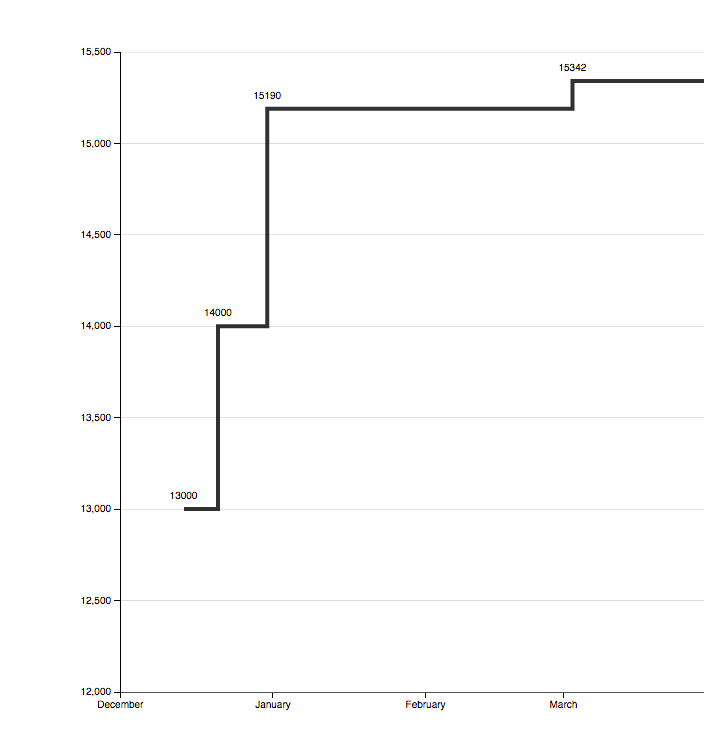
});Some styling still needs to be done but you can see that the y-values are now placed on the line graph. We are using lodash on this project but if you do not want to use lodash, just replace the _.forEach (line 10)and this technique should just plug in for you.
If you’re reading this it’s likely you’ve run into the same or similar issue and I hope this helps you!
Comments