Graphing System Statistics with Grafana

By Kirk Harr
August 21, 2015
Graphing System Statistics (the old fashioned way)
Since the mid 2000s system administrators who wanted to have a visual representations of their systems statistics had access to Graphite. This tool allows for elaborating graphs of values collected periodically to provide a representation of the data over time. Coupling this feature with collectd, which among many built-in supported metrics offer the possibility of sending system statistics to a central location running Graphite, allows to create a single portal for viewing statistics of your entire infrastructure easily. While this still remains a nice setup the graphical visualization capabilities of Graphite and rrdtool left some room for growth.
Enter Grafana
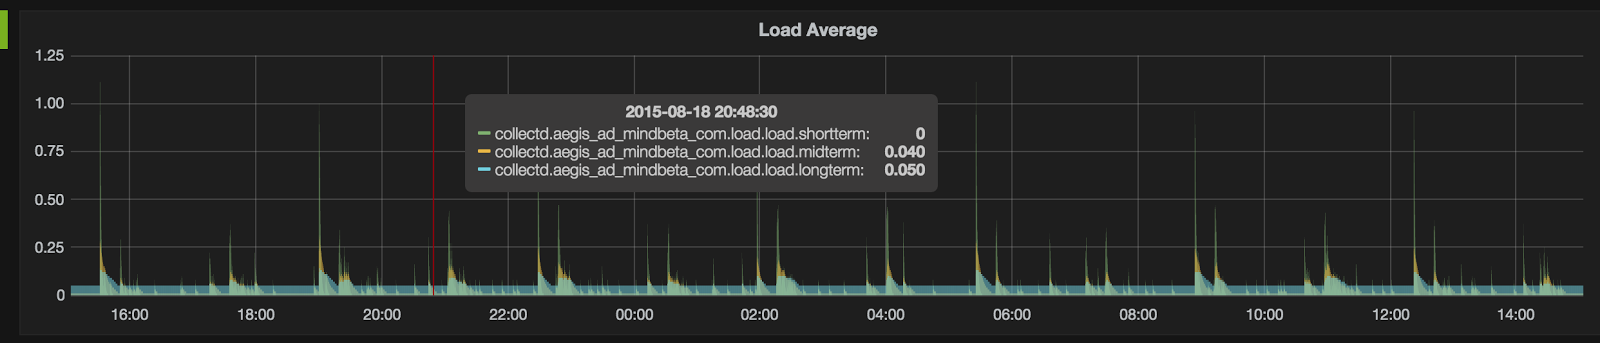
Grafana is a Graphite installation front-end that offers a very robust graphing/plotting library (provided by Flot) along with templates for creating similar displays for multiple datasets. Here you can see a comparison of the same dataset in both graphing libraries:
Graphite (rrdtool)
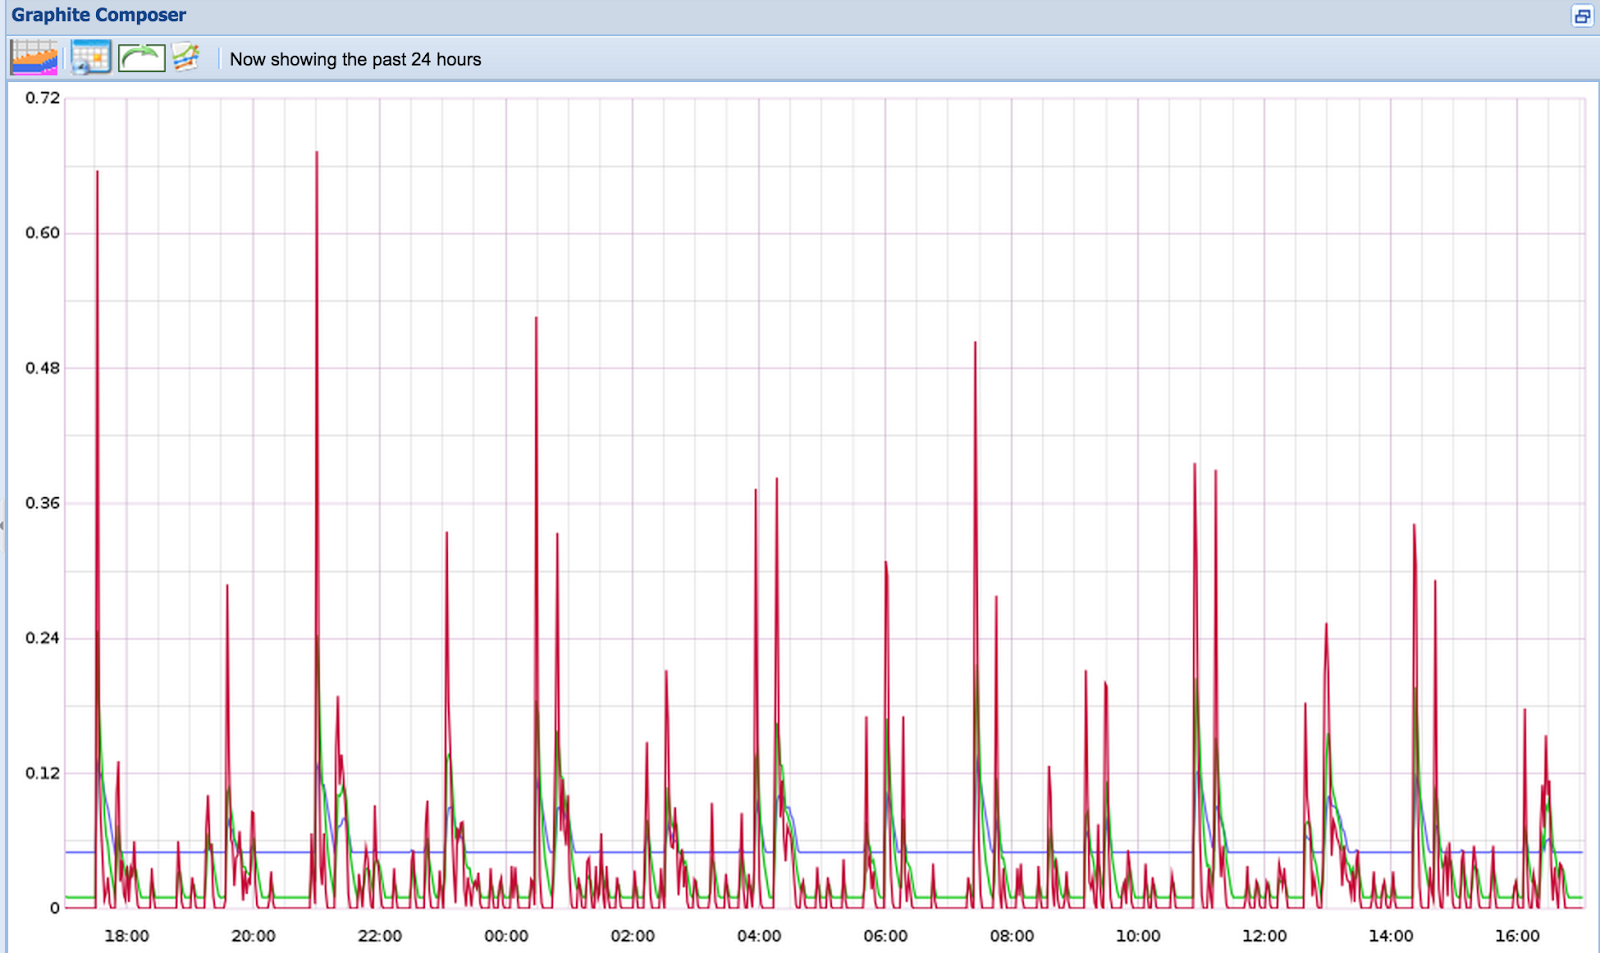
Grafana (Flot)
Data Analysis
Once you have setup collectd and Graphite to gather simple metrics from the servers you wish to monitor, you will easily have some basic instrumentation for focusing on system resources monitoring which is very helpful to keep an eye on your infrastructure performance and health. However the more data you start to harvest with collectd’s many plugins the bigger will be the need for some aggregation and analysis of the data to better understand what the data could be communicating. In this example there are two graphs, the top is a measure of the network traffic going across the external interface of a network firewall, and the bottom is a measure of the total traffic transformed using a logarithmic base 10 function on the data.
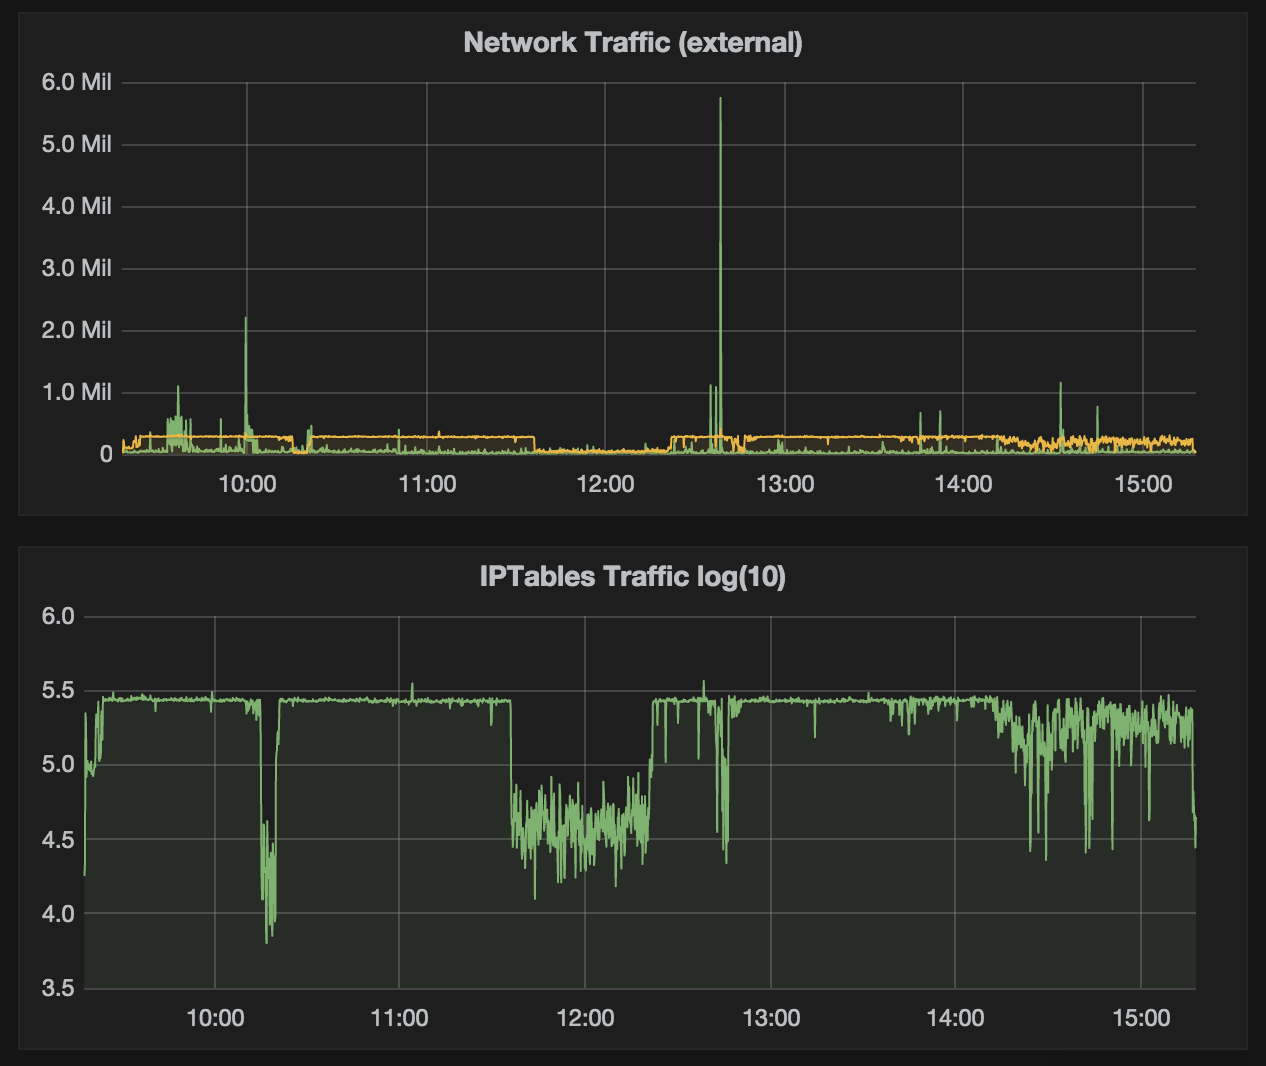
Within the logarithmic graph it’s easier to perceive the magnitude of the value, as a change in that graph of 1.0 in either direction would reflect a 10 fold change in the underlying data. Using this approach gives an operator a view of magnitude of the change and would so being able to easily track any spikes in the data values. Luckily Graphite offers a huge number of possible functions to elaborate the data before actually displaying it in the graph, they are all clearly documented here.
Dashboards
Going further you may want different contextual groups to aggregate systems by host or by application and with Grafana you can create a dashboard view which is customizable and can be populate with all the needed data. Here is an example of a dashboard for a system we have already seen:
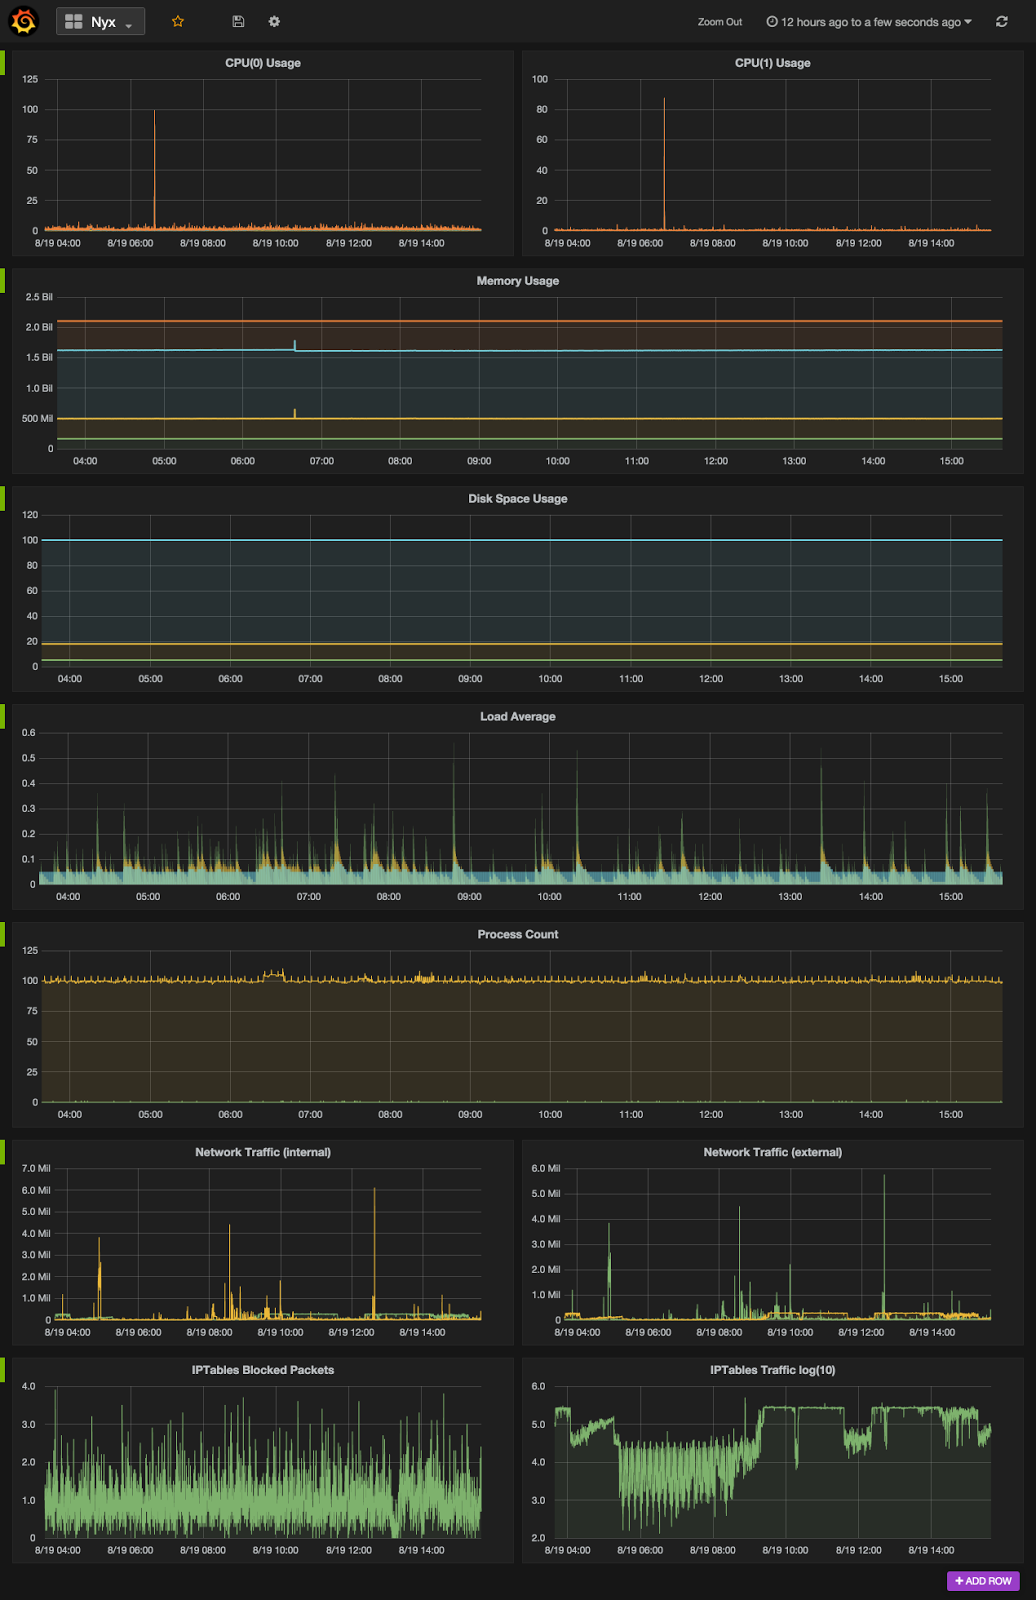
Mousing over any of the data within the charts will allow for detailed examination of the data values measured at that time period and provides the legend for each color in the chart. Changing the dataset timeframe is as simple as adjusting the dropdown near the top of the page, or clicking and dragging a duration onto one of the graphs.
The graphing library Flot provides a huge number of features and a very modern visual style which improved on what Graphite had to offer with rrdtool.
Conclusions
Graphite and collectd offered (and still do) a really robust data collection and analysis tools for measuring groups of computers. However this data seemed trapped in a display front-end which just could not meet the needs administrators who wanted to investigate deeper the collected data. Now Grafana provides a vastly improved graphing engine (also thanks to Flot), and combines all the needed tools like templates and dashboards to really empower users and system administrators about what they could do with the collected data.
We won’t be the first to say it but we do confirm that the combination of the great gathering and analysis capabilities powered by Graphite and collectd with a robust front-end with Grafana creates a very powerful tuning and monitoring stack.
Comments