The Portal project — Jenkins Continuous Integration summary

By Zdeněk Maxa
June 9, 2015
This post describes some of our experiences at End Point in designing and working on comprehensive QA/CI facilities for a new system which is closely related to the Liquid Galaxy.
Due to the design of the system, the full deployment cycle can be rather lengthy and presents us with extra reasons for investing heavily in unit test development. Because of the very active ongoing development on the system we benefit greatly from running the tests in an automated fashion on the Jenkins CI (Continuous Integration) server.
Our Project’s CI Anatomy
Our Jenkins CI service defines 10+ job types (a.k.a. Jenkins projects) that cover our system. These job types differ as far as source code branches are concerned, as well as by combinations of the types of target environments the project builds are executed on.
The skeleton of a Jenkins project is what one finds under the Configure section on the Jenkins service webpage. The source code repository and branch are defined here. Each of our Jenkins projects also fetches a few more source code repositories during the build pre-execution phase.
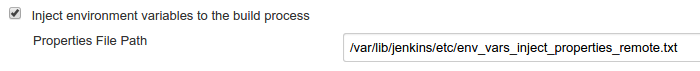
The environment variables are defined in a flat text file:
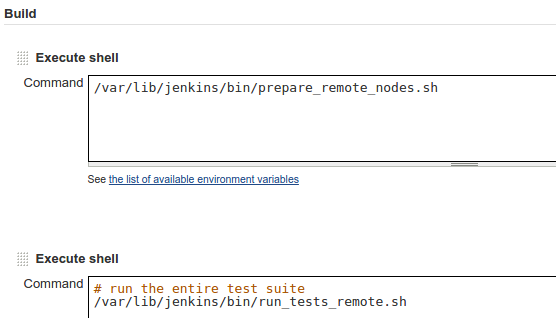
Another configuration file is in the JSON format and defines variables for the test suite itself. Furthermore, we have a preparation phase bash script and then a second bash script which eventually executes the test suite.
Factoring out all degrees of freedom into two pairs of externally managed (by Chef) concise files allows for pure and simple Jenkins job build definition:
It’s well possible to have all variables and content of the bash scripts laid out directly in the corresponding text fields in the Jenkins configuration. We used to have that. It’s actually a terrible practice and the above desire for purity comes from a tedious and clumsy experience that changing a variable (e.g. an URL or such) in 10+ job types involves an unbearable amount of mouse clicking through the Jenkins service webpage. Performing some level of debugging of the CI environment (like when setting up ROS stack which the project depends on) one is in for repetitive strain injury.
In essence, keeping knowledge about job types on the Jenkins server itself at a minimum and having it managed externally serves us well and is efficient. Another step forward would be managing everything (the entire job type definition) by Chef. We have yet to experiment with the already existing Chef community cookbooks for Jenkins.
The tests themselves are implemented in Python using pytest unit testing envelope. The test cases depend on Selenium—the web automation framework. Python drives the browser through Selenium according to testing scenarios, sometimes rather complex. The Selenium framework provides handles by which the browser is controlled—this includes user data input, clicking buttons, etc.
We use Selenium in two modes:
local mode: selenium drives a browser running on the Jenkins CI machine itself, locally. The browser runs in the Xvfb environment. In this case everything runs on the Jenkins master machine.
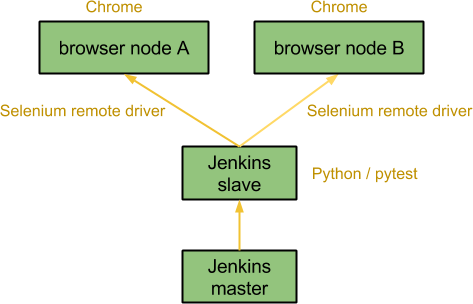
remote mode: the remote driver connects to a browser running on a remote machine (node A, B) and drives the browser there, as described in the diagram below. The test cases are run on the Jenkins slave machine located on a private network. The only difference between browser A and B is that they load their different respective Chrome extensions.
The usual unit testing assertions are made on the state or values of HTML elements in the web page.
Custom dashboard
Our Jenkins server runs builds of 10+ various job types. The builds of each type are executed periodically and the builds are also triggered by git pushes as well as by git pull requests. As a result, we get a significant number of builds on daily basis.
While Jenkins CI is extensible with very many plugins available out there, enabling and configuring a plugin gets cumbersome as the number of job types to configure rises. This is just to explain my personal aversion to experimenting with plugins on Jenkins for our project.
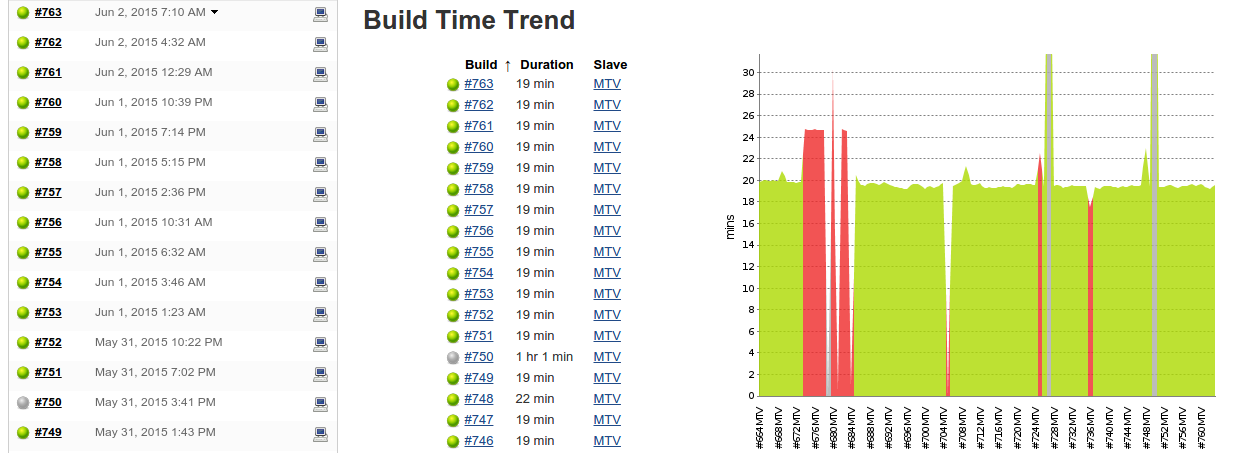
The Jenkins service webpage itself does not offer creating a simple aggregated view across a number of job types to allow for a simple, concise, single page view. Natively, there is just the single job type trends $JOB_URL/buildTimeTrend page (see below).
A view which immediately tells whether there is an infrastructure problem (such as loss of connectivity) or conveys straight away that everything passes on Jenkins, seems to be missing. Such a view or feature is even more important in an environment suffering from occasional transient issues. Basically, we wanted a combination of JENKINS/Dashboard+View and JENKINS/Project+Statistics+Plugin, yet a lot simpler (see below).
So yes, we coded up our own wheel, circular just according to our liking and thus developed the jenkins-watcher application.
jenkins-watcher
The application is freely available from this repository, deploys on the Google App Engine platform and so utilizes certain platform features like Datastore, Cron jobs, TaskQueue and Access Control. A single configuration file contains mainly Jenkins CI server access credentials and job type names we are interested in. The above repository merely provides a template of this (secret) config file. AngularJS is used on the frontend and a smashing Jenkins API Python library is used to communicate from Python to the Jenkins CI server through its REST API. See below the result view it provides, the screenshot is cropped to show only 5 job types and their builds within the last 24 hours:
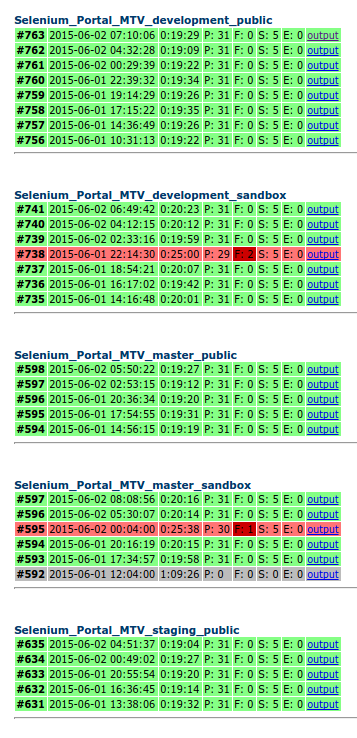
Colour coding in green (passed), red (failed) and grey (aborted) shows a build status and is in fact just standard Jenkins colour coding. Each table row corresponds to 1 build of the build ID, build timestamp (start of the build), build duration, number of test cases which passed (P), failed (F), were skipped (S), or suffered from errors (E). The last item in the row is a direct link to the build console output, very handy for immediate inspection. In my experience, this is enough for a Jenkins babysitter’s swift daily checks. This is nothing fancy: no cool stats, graphs or plots. It is just a brief, useful overview.
The application also performs periodic checks and aborts builds which take too long (yes, a Jenkins plugin with this functionality exists as well).
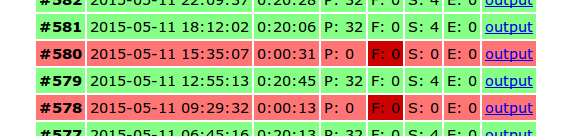
For example, at a glance it’s obvious that the following failed builds suffer from some kind of transient infrastructure problems: no tests were run, nothing failed, the builds were marked as failure since some command in either their prep or build scripts failed:
Or let’s take a look at another situation proving how simple visualisation can sometimes be very useful and immediately hint-providing. We observed a test case, interestingly only on just one particular job type, which sometimes ended up with a “Connection refused” error between the Selenium driver and the web browser (in the remote mode):
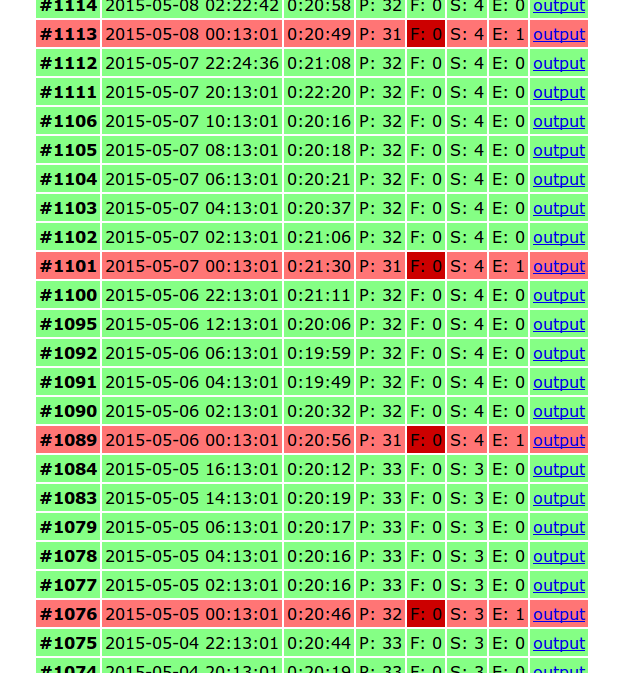
Only after seeing the failures visualized, the pattern struck us. We immediately got an idea that something is rotten in the state of Denmark shortly after midnight: from that point on, the previously mysterious issue boiled down to an erroneous cronjob command. The killall command was killing everything and not just what it was supposed to (bug filed here):
killall –older-than 2h -r chromedriver
Once we fixed the cronjob with a more complex but functional solution, without the killall command this time, so that the builds had not the chromedriver blanket pulled from under them while running, the mysterious error disappeared.
Summary, conclusion
Jenkins CI proved in general very useful for our Portal project. Keeping its configuration minimal and handling it externally worked most efficient. The custom jenkins-watcher application provides useful, aggregated, dashboard-like view. It is very easily configurable and not in any way dependent on the base project—take it for free, configure a bit and push as your own Google App Engine project. The visualisation can sometimes be a useful debugging tool.
chef browsers jenkins visionport python testing
Comments