Analyzer Reports with Geo Map Option in Pentaho 5 BI Server

By Selvakumar Arumugam
September 12, 2014
The “Geo Map” option in Analyzer Reports provides a feature to visualize data with geographic locations. We will learn how to design a Mondrian schema and configure Pentaho to make use of the “Geo Map” feature in the Analyzer Reports. This article will show us how to set this feature up step by step.
Enable Geo Map feature on Geographic fields in Mondrian Schema
The Mondrian schema has two main categories called Dimensions and Measures. The Dimensions are defined as levels in the Mondrian schema. The Geographic fields should have two additional annotations to use Geo Map. The two annotations are:
-
Data.Role — defines the type of level generally; for this type of node, this must be set to ‘Geography’.
-
Geo.Role — defines the geographical classification in a hierarchy. These can be either predefined roles (‘country’, ‘state’, ‘city’, ‘postalcode’) or custom roles.
Sample Level with Annotation:
<Level name="Country Name" visible="true" column="country" type="String" uniqueMembers="false" levelType="Regular" hideMemberIf="Never">
  <Annotations>
    <Annotation name="Data.Role"><![CDATA[Geography]]></Annotation>
    <Annotation name="Geo.Role"><![CDATA[country]]></Annotation>
  </Annotations>
</Level>
Geographic fields and datasets in database
I have created a sample table with the fields containing geographic locations for dimensions and aggregated value for measures. The sample population table contains Pentaho-defined geographic locations ‘country’, ‘state’, ‘city’ and aggregated population count for those geographic fields.
‘Population’ table design and datasets:
Here we create a sample population table with geographic fields and the population count in a PostgreSQL database.
CREATE TABLE population (
   id INT PRIMARY KEY   NOT NULL,
   country      TEXT    NOT NULL,
   state        TEXT    NOT NULL,
   city         TEXT   NOT NULL,
   count        INT    NOT NULL
);
Next we load population data into the table for 4 cities of 2 states in USA. (Population data for more geographic locations in USA are available at USA Population.)
# SELECT * FROM population;
 id | country |   state    |     city      |  count
----+---------+------------+---------------+---------
  1 | USA     | California | Los Angeles   | 3857800
  2 | USA     | California | San Francisco |  825863
  3 | USA     | New York   | Hilton        |    5974
  4 | USA     | New York   | Johnsburg     |    2390
Download the sql dump file with table schema and datasets.
Design a Mondrian Schema with Geographic Support
Pentaho provides a tool called “Schema Work Bench” to design a Mondrian schema for a specific table’s data. We can create a new Mondrian schema for the table by selecting File -> New -> Schema. The picture below depicts the hierarchy level of the Mondrian schema elements.
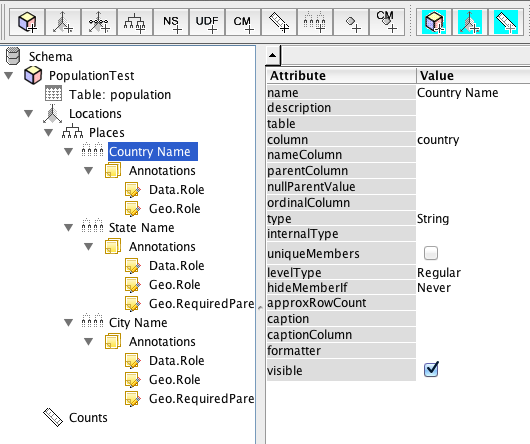
Publish the Mondrian schema to Pentaho
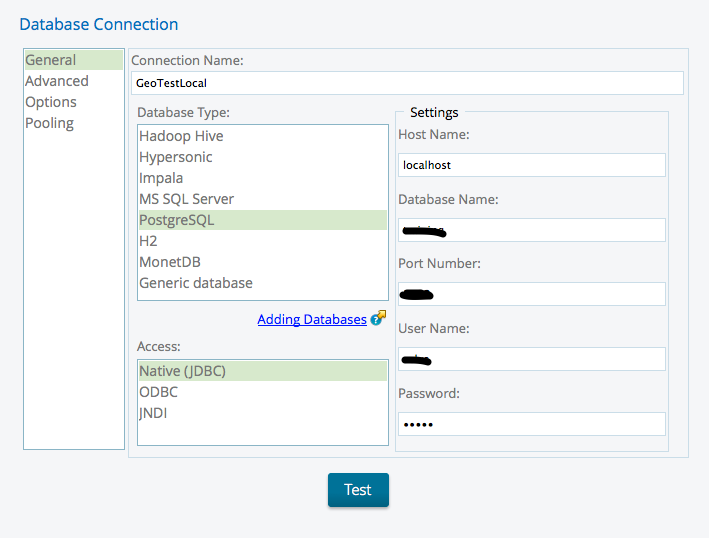
The publish process requires the JDBC datasource to have access to database. Create a JDBC datasource in the manage datasources wizard with necessary input values.
Once the JDBC datasource has been created in Pentaho server, the Mondrian schema can be published from the Schema Work Bench.
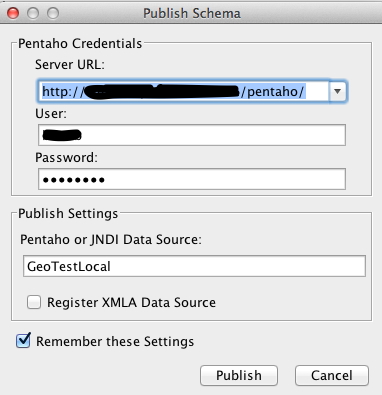
Download the Mondrian schema xml to view the schema, cube, table, dimension, hierarchy, level, annotations, measures elements and corresponding attribute values.
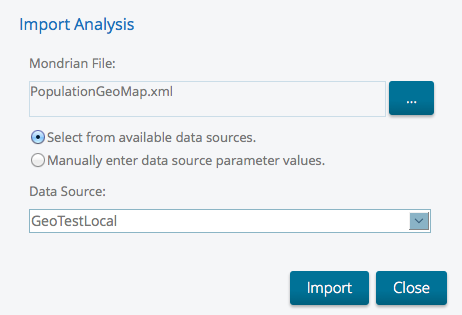
The Mondrian schema xml can be imported directly into Pentaho server to create an analysis datasource.
Create a Analyzer Report with Geo Map
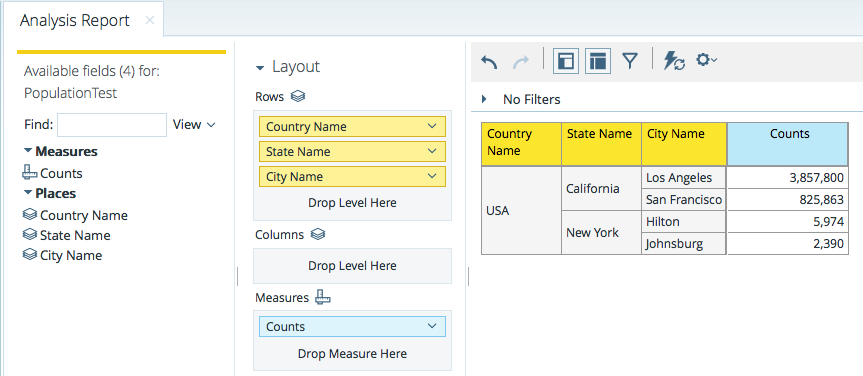
Add the necessary geographic fields under “Rows” and population count under “Measure” to create a basic analyzer report.
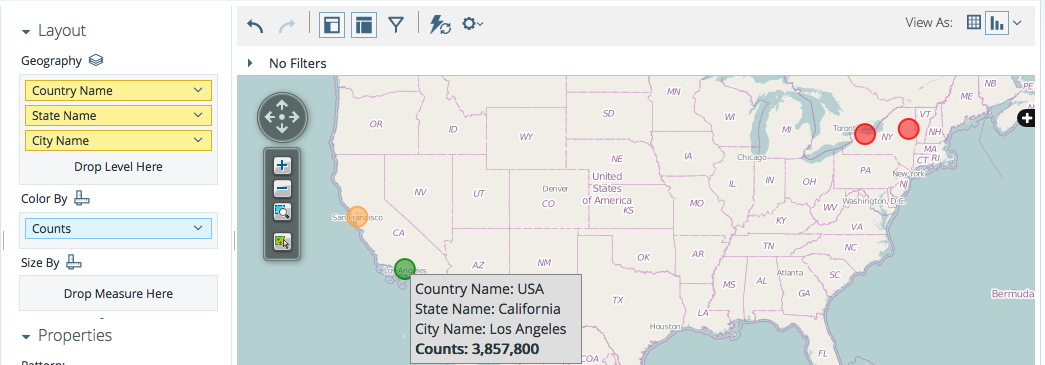
Change the report type to “Geo Map” through the right top corner options to view the visualized data. Congratulations, you’re done!
gis pentaho postgres reporting casepointer
Comments