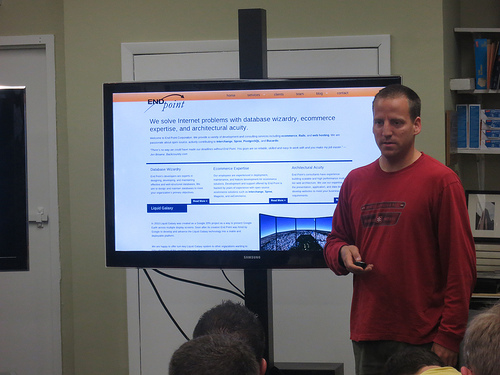
Josh Tolley: About Google Earth Tours
Josh Tolley spoke on the building of tours for viewing within Google Earth and the Liquid Galaxy. It seems that everybody has data and wants a way to view it, such as businesses who want to visually represent where their customers are based, or even documenting where lightning strikes within a certain region. Google Earth is a fantastic tool for the viewing of this data.
Josh talked about what is required to display geographical data in Google Earth. The data needs to go through the process of geocoding, which is the conversion to latitudinal and longitudinal format. As this is a tedious process, it is highly recommended to use a script and loop through the conversion. Google Earth is based upon KML documents, which are XML documents that contain geographical data. He explained some of the different ways to create the KML documents, including the use of Google Earth itself, writing by hand, or using a tool such as kamelopard or PyKML to create the data.
He demonstrated how a KML file can contain data such as placemarks, polygons, time lapses, overlays, and animations, and he showed his own farm with an overlay placed in the wheat field. Now the zombies know where to find wheat. Josh talked about the uses of Google Earth tours, including the display of ocean currents, tsunami shock waves, wind patterns, and even historical events with a time lapse.
Kamelopard is a Ruby-based KML writer that Josh created. It uses Ruby code to identify a point, fly to it, stay there for a bit, then fly to the next place. It loops through all of the coordinates given and creates a tour. An example tour that Josh has written is one for Google’s Ocean Conservation Group, which displays fishery data around the world.
KML can handle large datasets, and has multiple ways of being displayed. It can have regions and ground overlays, and combining the two can show increasingly detailed images and sets of placemarks as the level of zoom increases. DataAppeal can create maps with various models in them, scaling and coloring them based upon users’ data.
google-earth visionport kamelopard kml


Comments