Google Earth KML Tour Development Challenges on Liquid Galaxy

By Adam Vollrath
February 24, 2011
Because Liquid Galaxy runs Google Earth, it can easily visualize an organization’s GIS data. End Point also develops tours within Google Earth to better present this data. A Liquid Galaxy’s networked multi-system architecture presents unique technical challenges to these tours.
Many Google Earth tours incorporate animations and dynamic updates using the <gx:AnimatedUpdate> element. KML features in the Earth environment can be modified, changed, or created during a tour, including the size, style, and location of placemarks, the addition of ground overlays, geometry, and more.
However, these updates are only executed on the Liquid Galaxy master system running the tour, not sent to its slaves. Liquid Galaxy nodes communicate primarily via ViewSync UDP datagrams. These datagrams contain only the master’s position in space and time. This means we cannot use <gx:AnimatedUpdate> to animate features across all Liquid Galaxy systems, sharply limiting its utility.
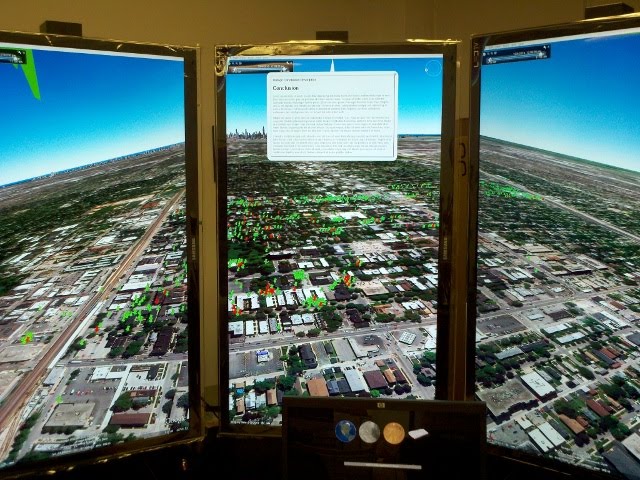
But tours can also use chronological elements to display, animate, and hide features. Using <gx:TimeSpan> or <gx:TimeStamp> within an tour stop enables flying to a specific location in space and time. All Google Earth features may be assigned a TimeStamp, and all Liquid Galaxy screens display the same chronological range of features. This works around the single-system limitation on animation, and enables sweeping changes across all screens. The picture below shows a data animation in progress across three screens; the green dots are filling in the area previously occupied by the red dots, while the time sliders in the upper left corners advance.
Taking this technique a step further, we also “wrapped” some very large KML datasets in NetworkLink elements, and wrapped those NetworkLinks in Folder elements with TimeStamp elements as well. This allowed fine control over when to fetch and render the large set, just-in-time to be featured in its own tour. These large loads can cause the Earth client to stutter, so we also stopped the flight motion and displayed a balloon full of text for the audience. A KML example of this wrapper is below.
<Folder>
    <name>Region Link Two</name>
    <TimeStamp><when>2010-09-19T16:00:00Z</when></TimeStamp>
    <NetworkLink>
         <name>Region Link Two</name>
         <Region>
              <LatLonAltBox>
                   <north>41.8</north>
                   <south>41.6</south>
                   <east>-86.1</east>
                   <west>-86.3</west>
              </LatLonAltBox>
              <Lod>
                   <minLodPixels>256</minLodPixels>
                   <maxLodPixels>-1</maxLodPixels>
              </Lod>
         </Region>
         <Link>
              <href>network_view.kml</href>
              <viewRefreshMode>onRegion</viewRefreshMode>
         </Link>
    </NetworkLink>
</Folder>
These techniques, and the Liquid Galaxy platform, combine to coordinate a moving visual experience across the audience’s entire field of view. Animations highlight GIS data and narrate its story, creating an impressive presentation.
Comments